Technology services sector market review: FY 2020
Welcome to the FY 2020 edition of our Technology Services Perspective – Results International’s full year market update of the technology services sector.
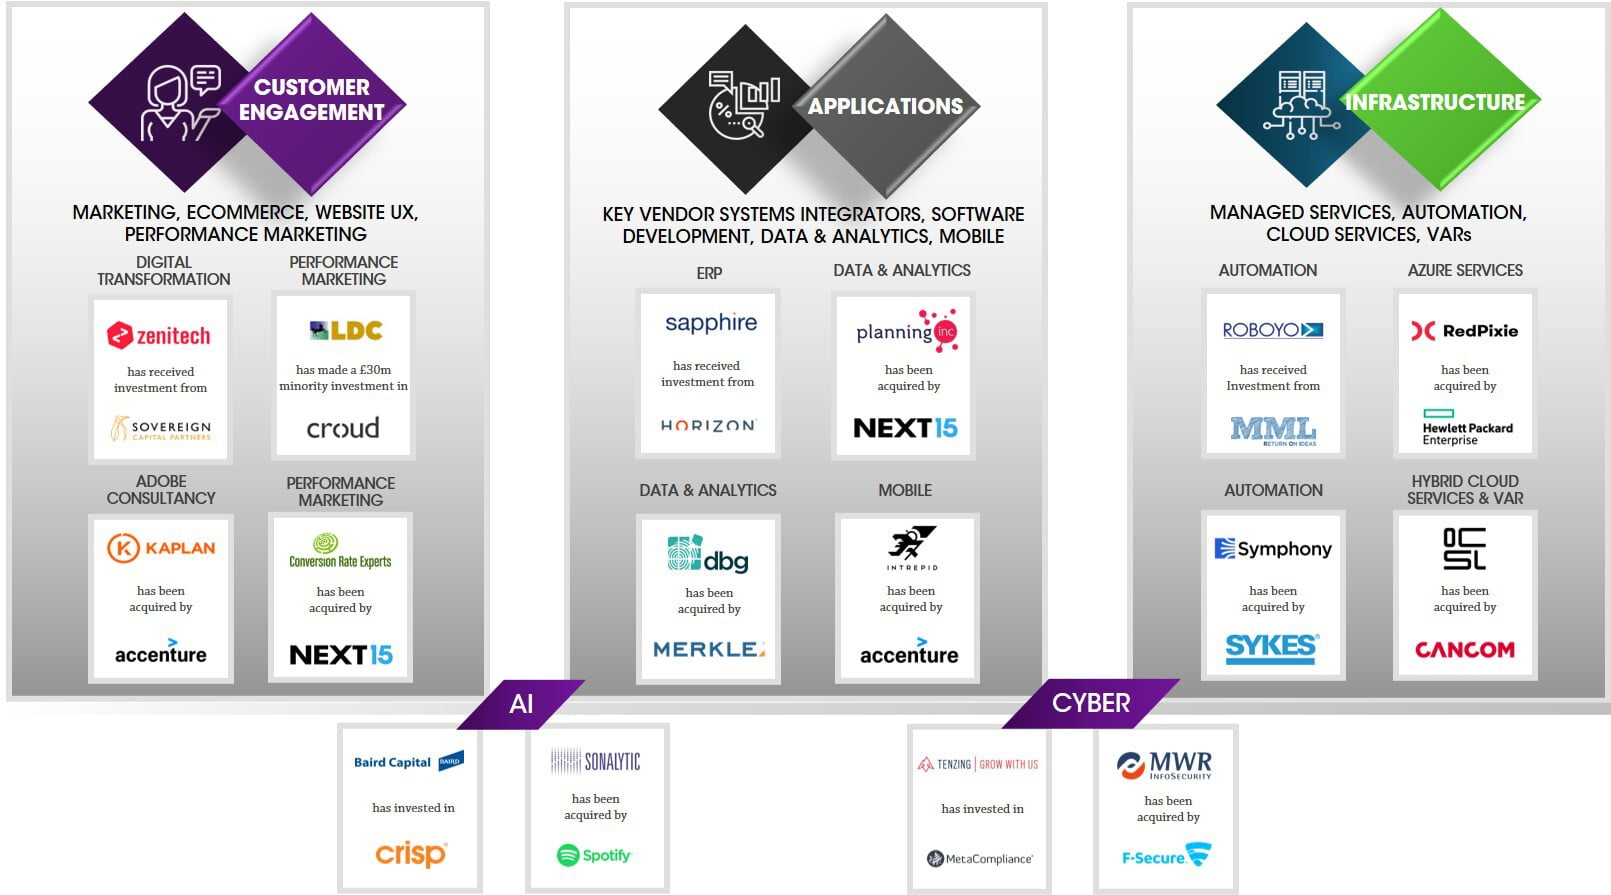
The subsectors we track include (i) customer engagement (marketing & eCommerce, website UX and performance marketing), (ii) applications (key vendor systems integrators, software development, data & analytics and mobile), (iii) infrastructure (managed services, automation, cloud services and VARs), (iv) AI and (v) cybersecurity services. Separately, we cover the broader marketing services market (beyond the customer engagement categories mentioned above) in our quarterly Marketing Services Market Review and security software in our quarterly CyberScope.
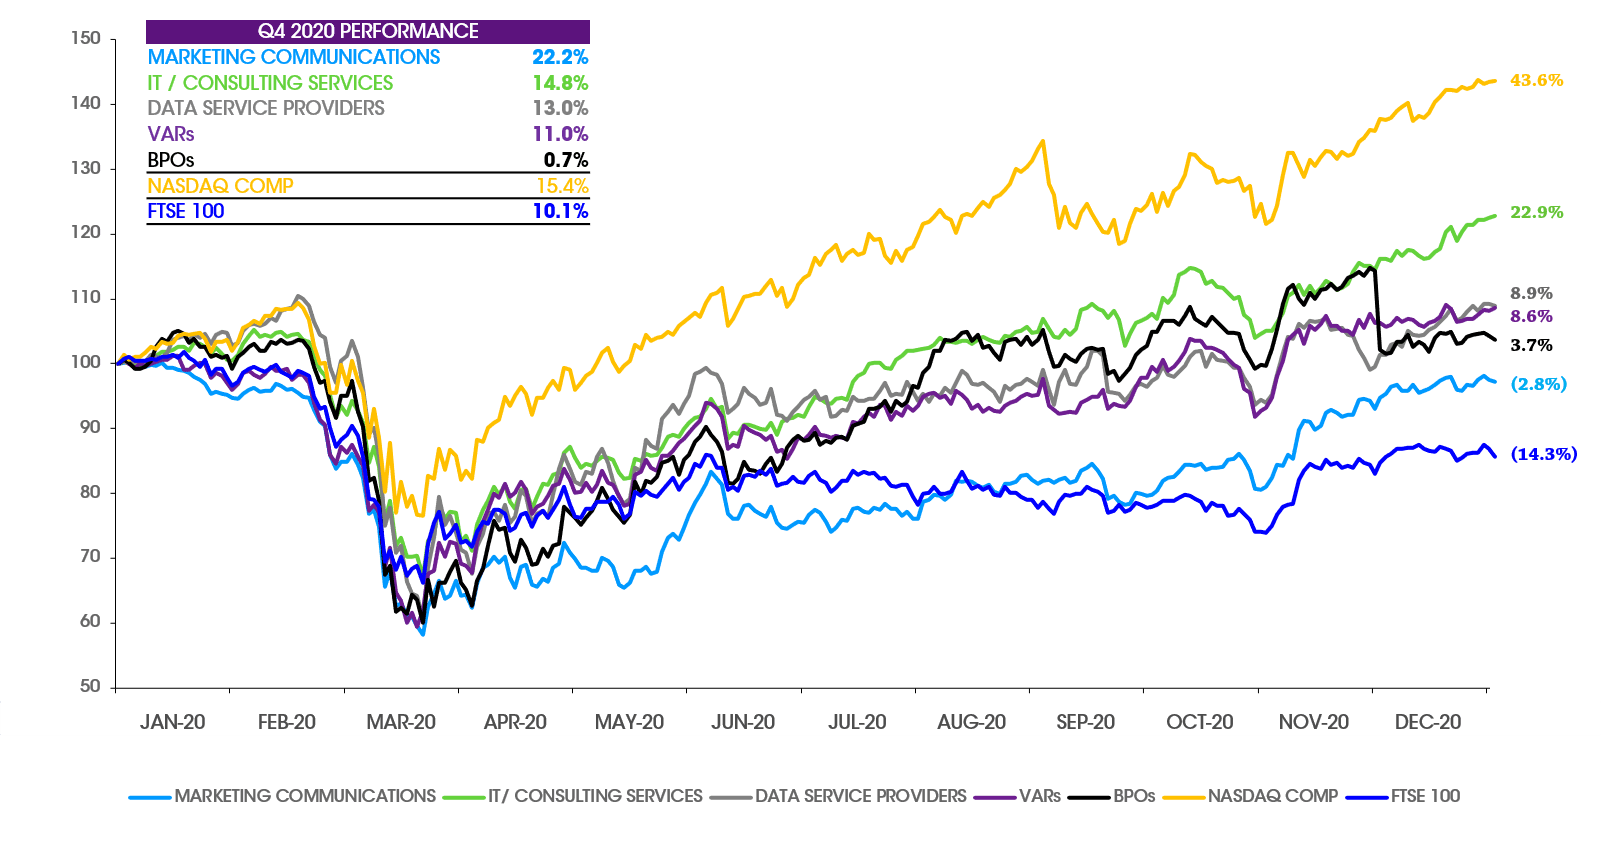
Across the board, the global technology services market received continued confidence from investors and buoyancy in M&A throughout 2020, amidst the highly disruptive global pandemic. Public market performance for key stocks remained on a steady growth trajectory and M&A volumes consistently remained at prior year levels.
Notes: Based on share prices as at 31th December 2020; indices weighted by market capitalisation. Sources: Capital IQ and Results International analysis
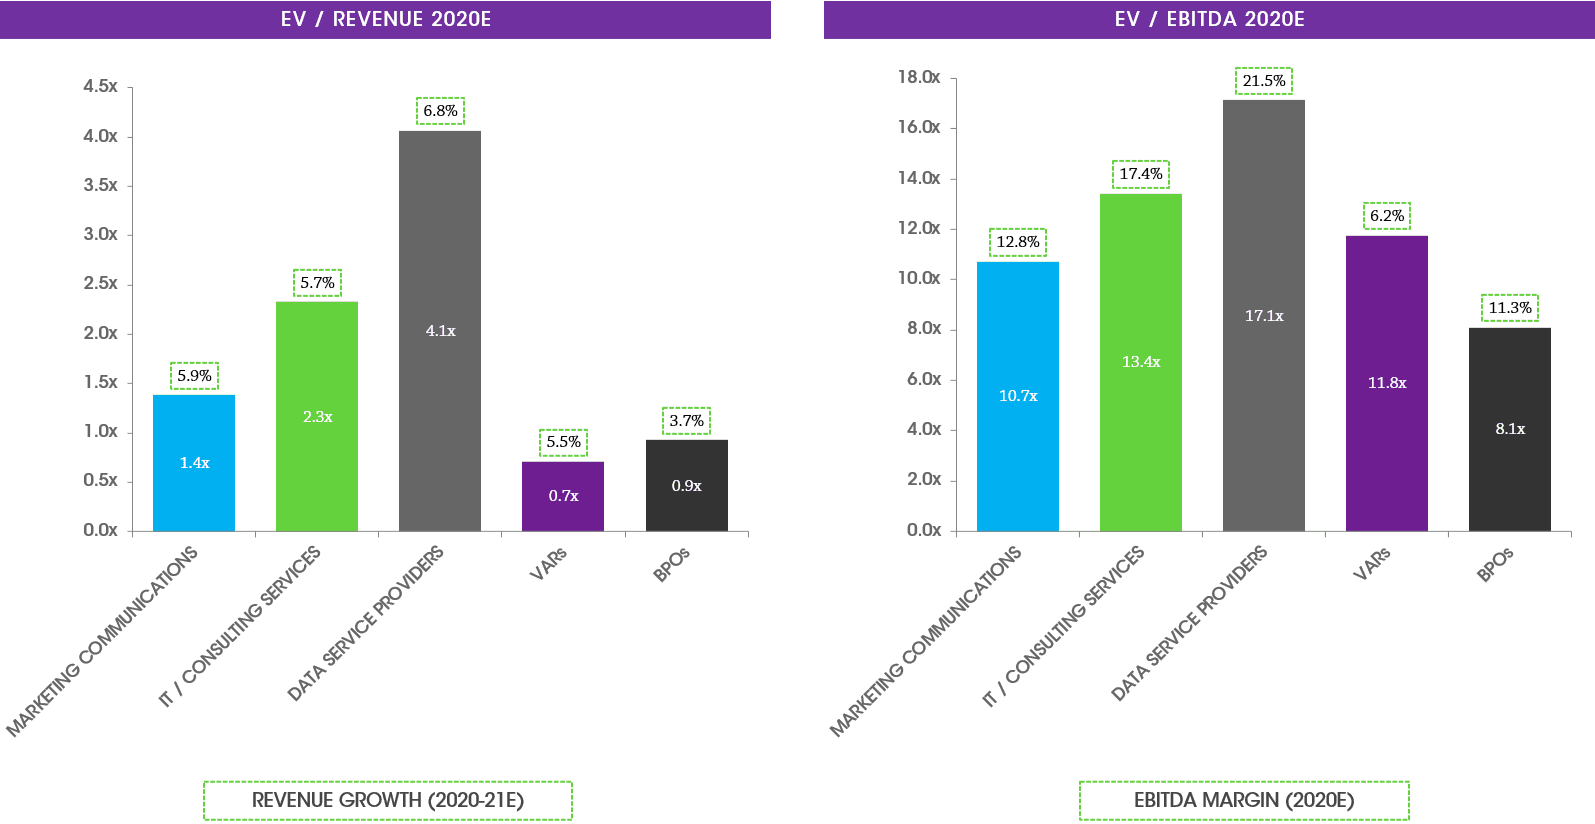
Note: EV = Enterprise Value; financials calendarised to December year end; median values reported. See the Selected Publicly Traded Companies section of this document for details of companies included in each category. Source: Capital IQ.
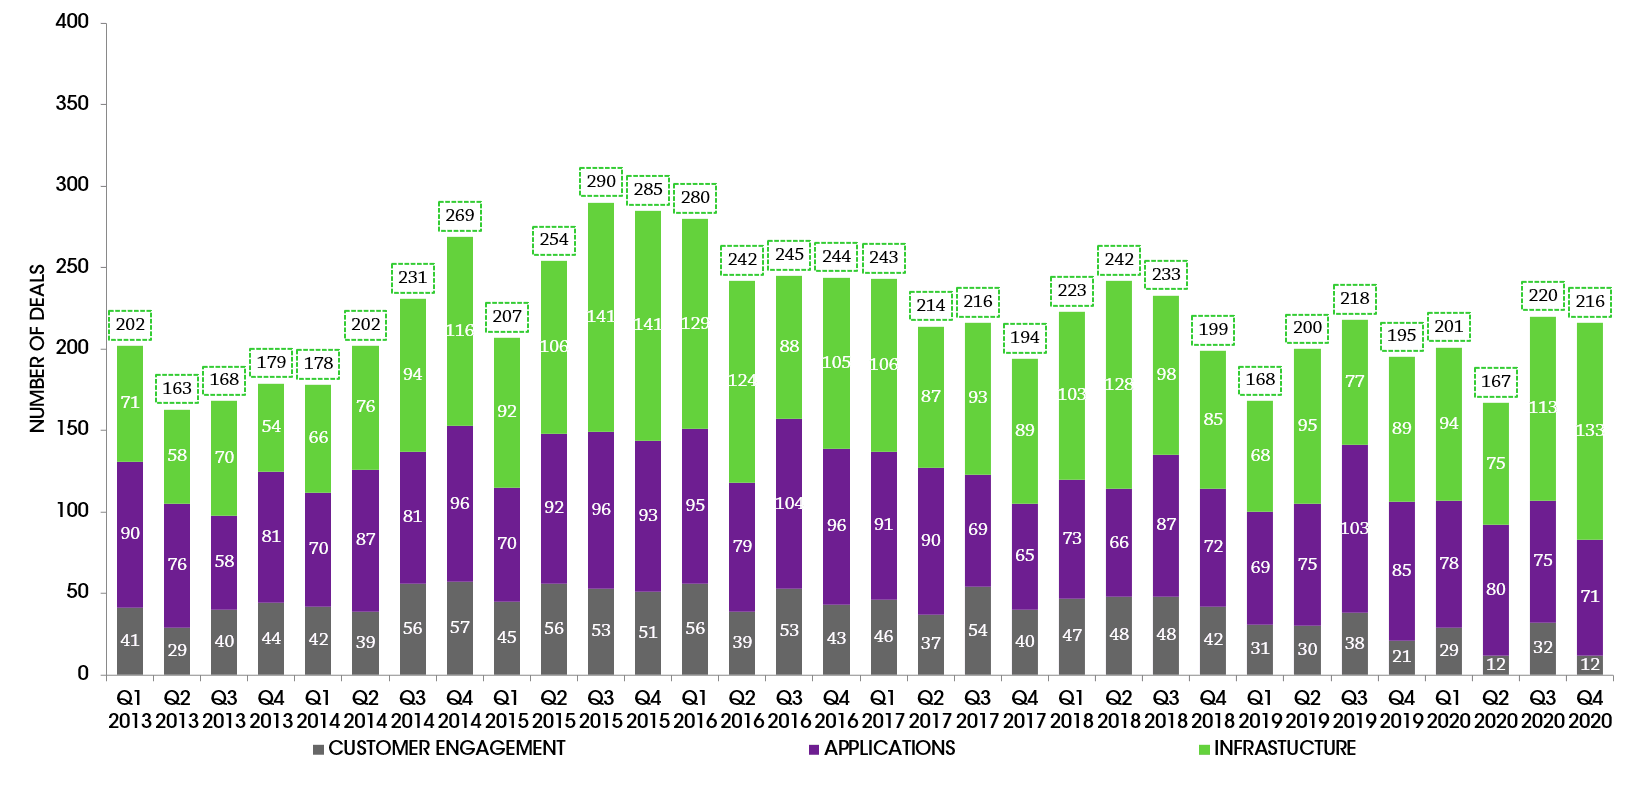
Sources: Press releases, Capital IQ, Mergermarket, 451 Research and Results International analysis.
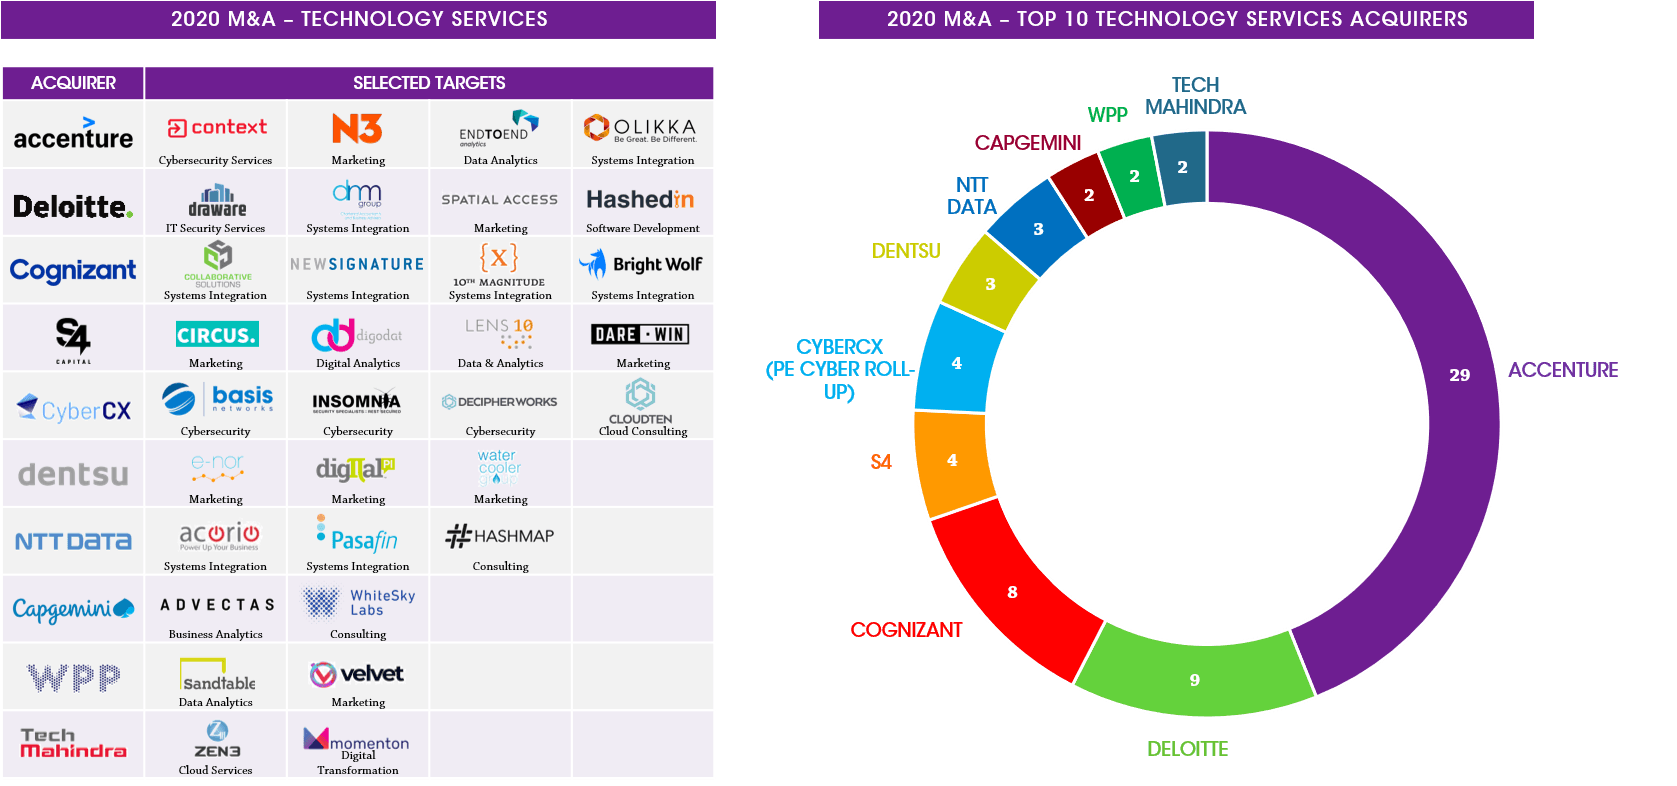
Note: Parent shown as acquirer when acquisition made through group subsidiary/ group. Sources: Press releases, Capital IQ, Mergermarket, 451 Research and Results International analysis.
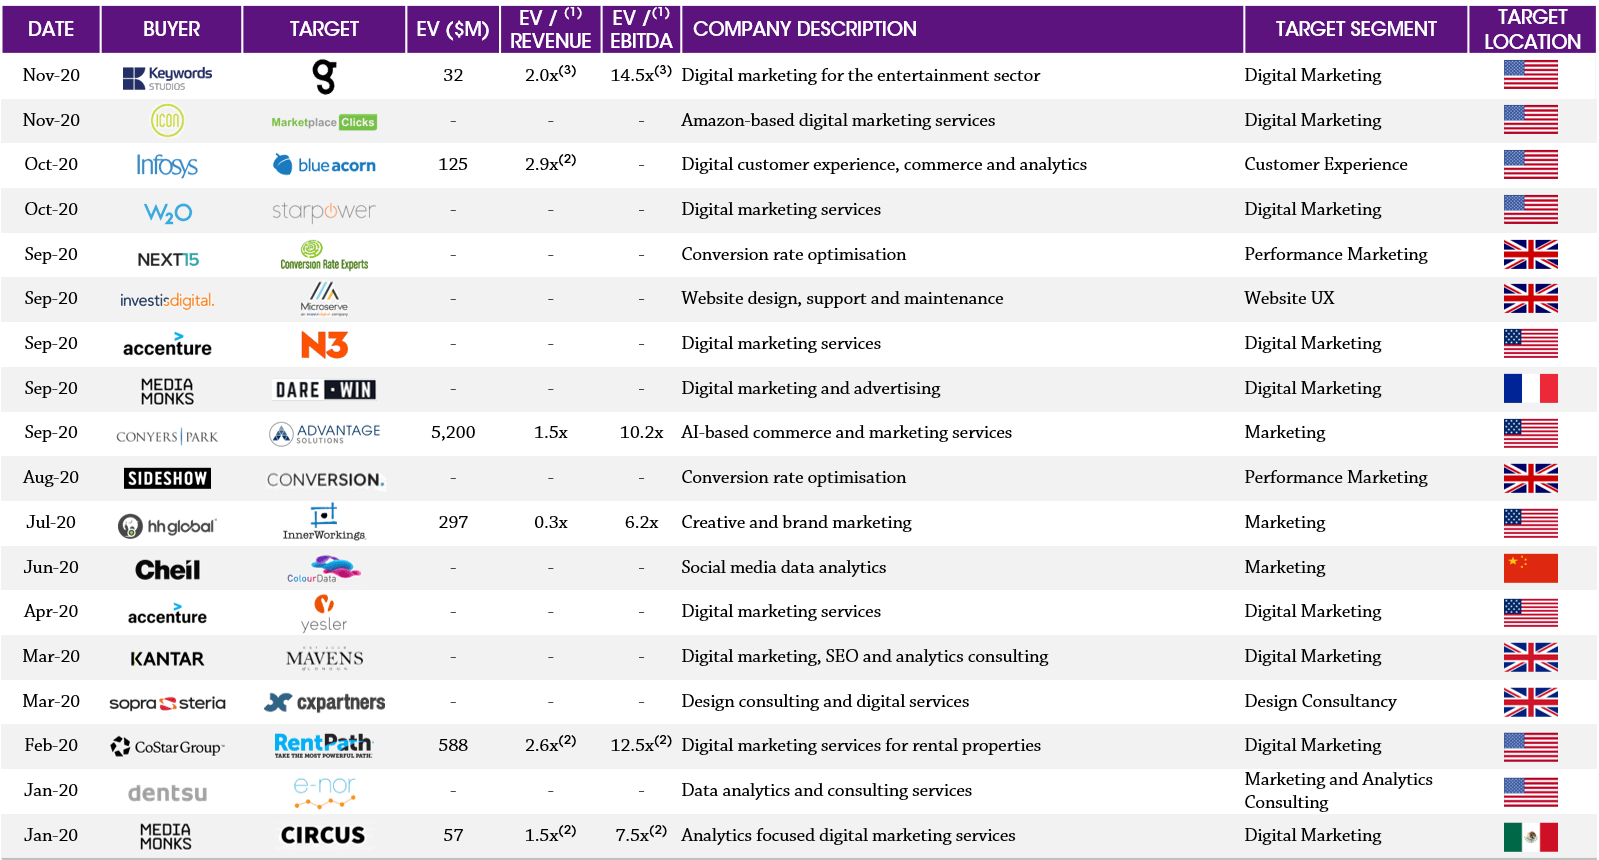
Note: (1) In certain cases EV/Revenue and EV/EBITDA are publicly reported estimates and includes deferred considerations; TTM financials have been used where possible; EV = transaction value scaled to 100% shareholding plus net debt (incl. minority interest). (2) Based on CY19 financials (3) Based on May’20 financials Sources: Press releases, 451 Research and Results International analysis.
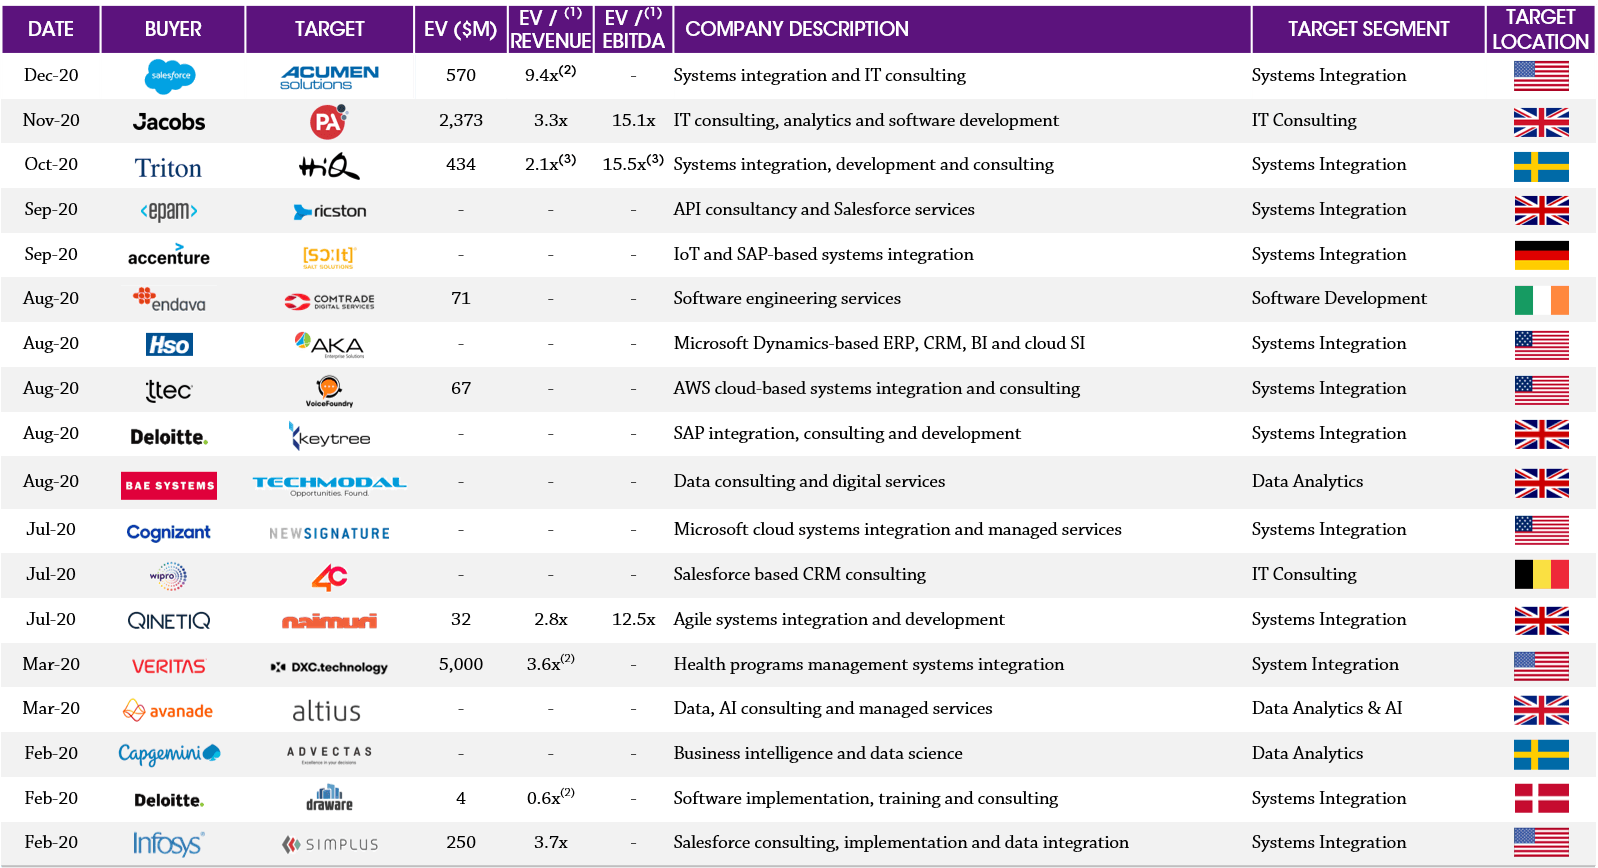
Note: (1) In certain cases EV/Revenue and EV/EBITDA are publicly reported estimates and includes deferred considerations; TTM financials have been used where possible; EV = transaction value scaled to 100% shareholding plus net debt (incl. minority interest). (2) Based on CY19 financials (3) Based on Jun’20 financials Sources: Press releases, 451 Research and Results International analysis.
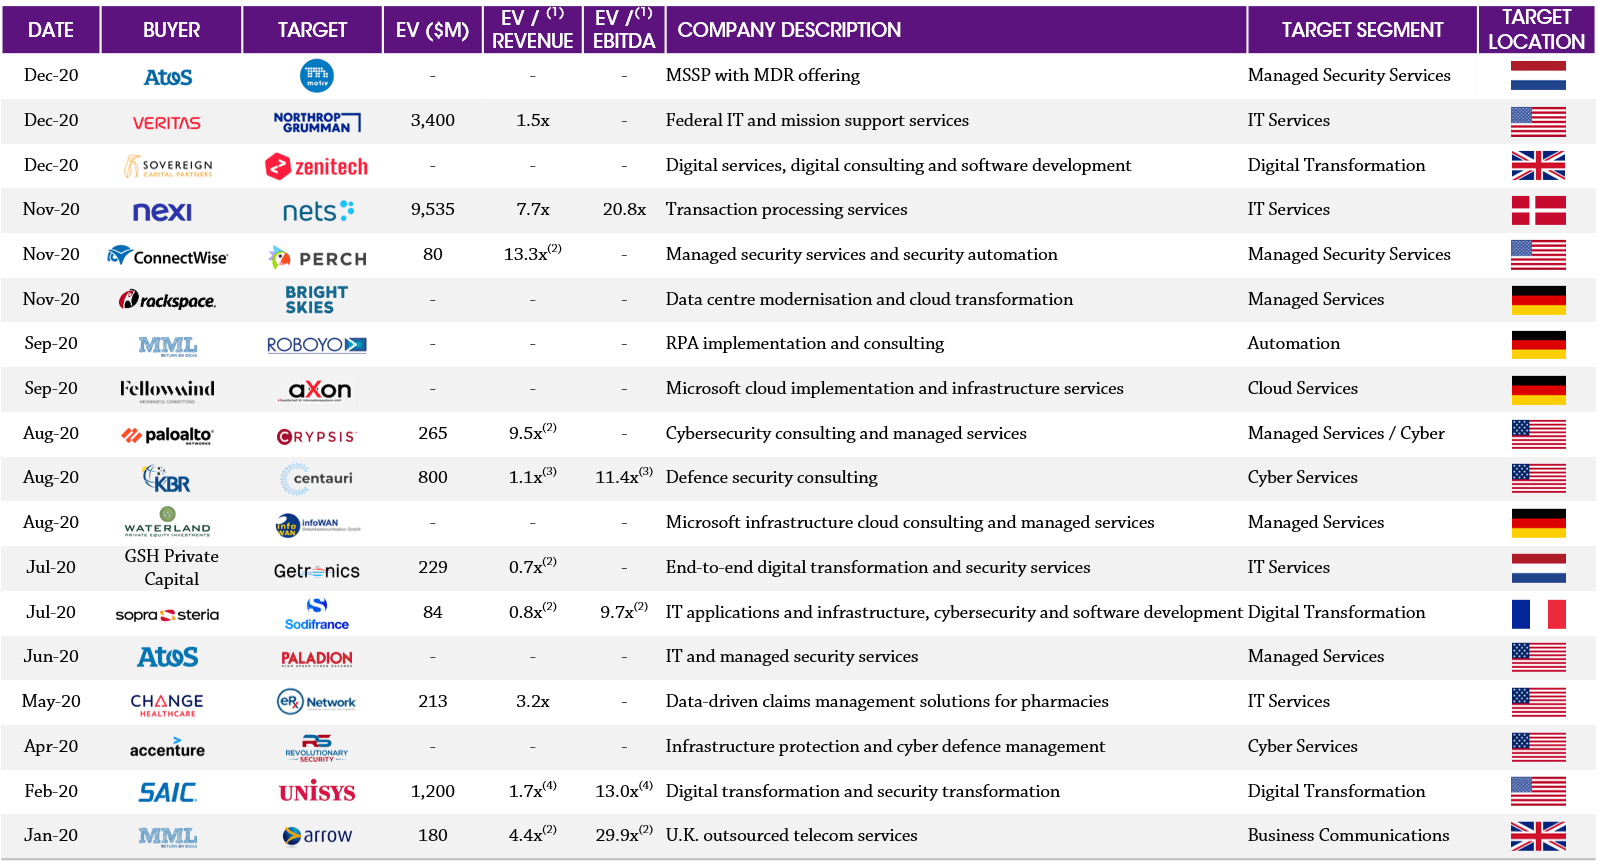
Note: (1) In certain cases EV/Revenue and EV/EBITDA are publicly reported estimates and includes deferred consideration; TTM financials have been used where possible; EV = transaction value scaled to 100% shareholding plus net debt (incl. minority interest). (2) Based on CY19 financials (3) Based on FY21 estimates (4) Based on Sep’19 financials. Sources: Press releases, Capital IQ, Mergermarket, 451 Research and Results International analysis
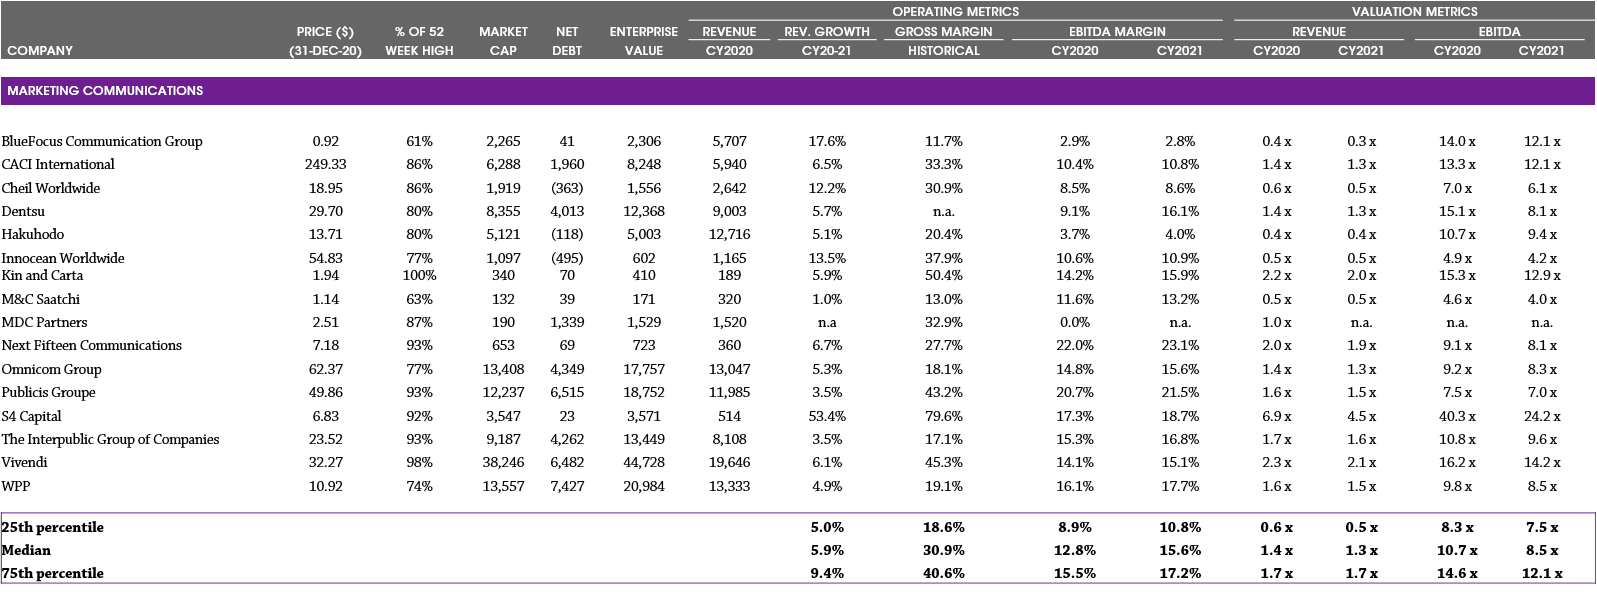
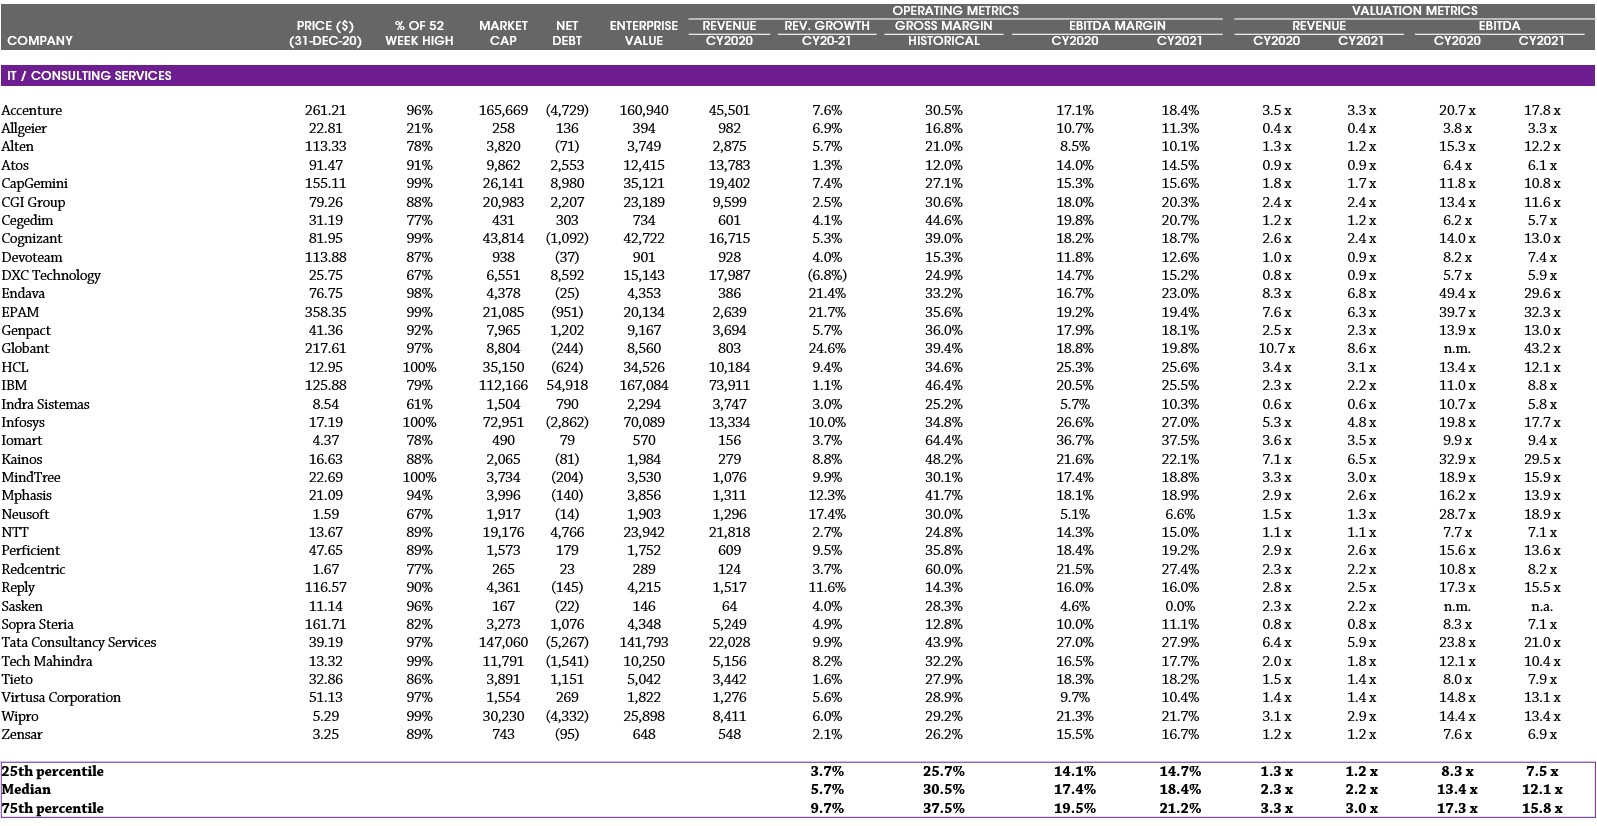
Note: Calendarised to December year end; $ millions, except share price data; multiples capped at 20x EV / Revenue and 50x EV / EBITDA; net debt includes minority interest. Source: Capital IQ.
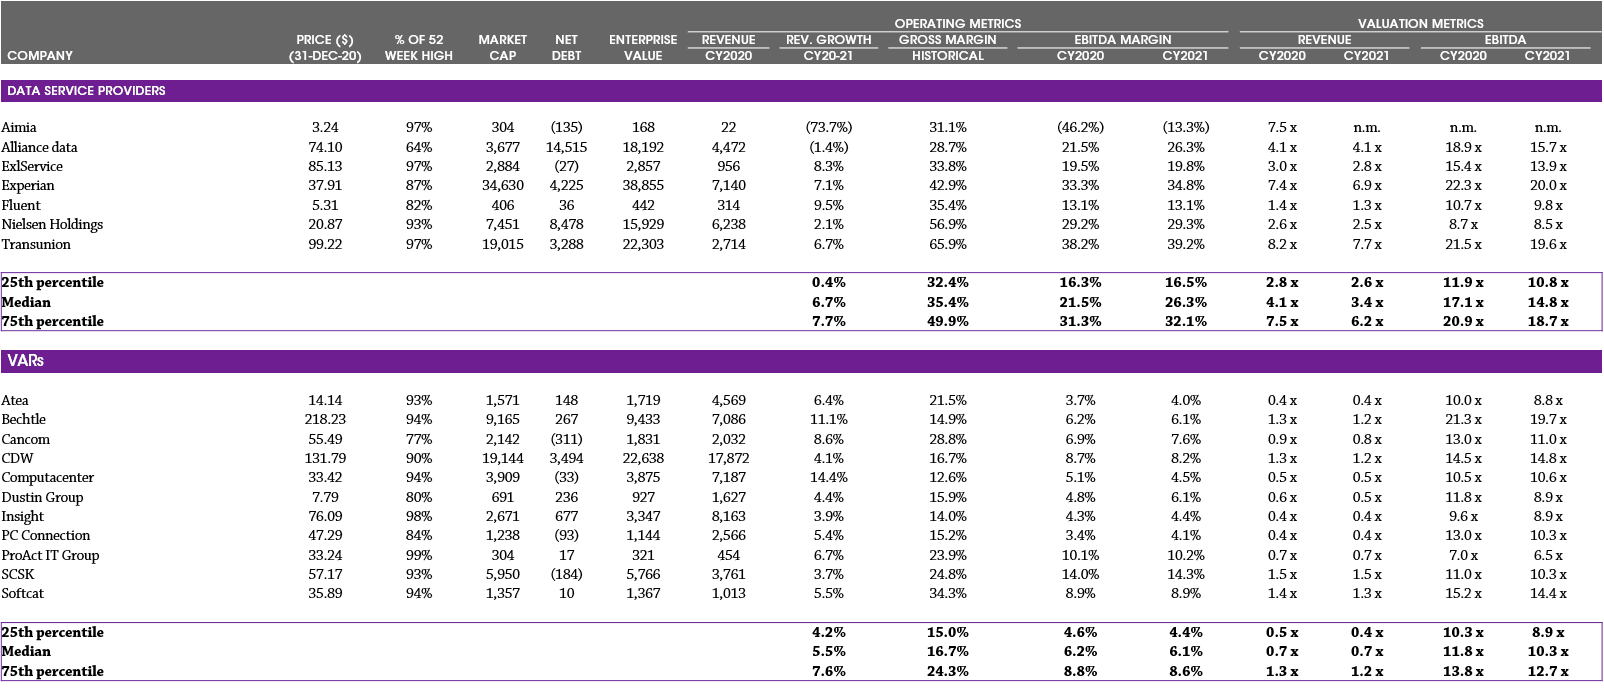
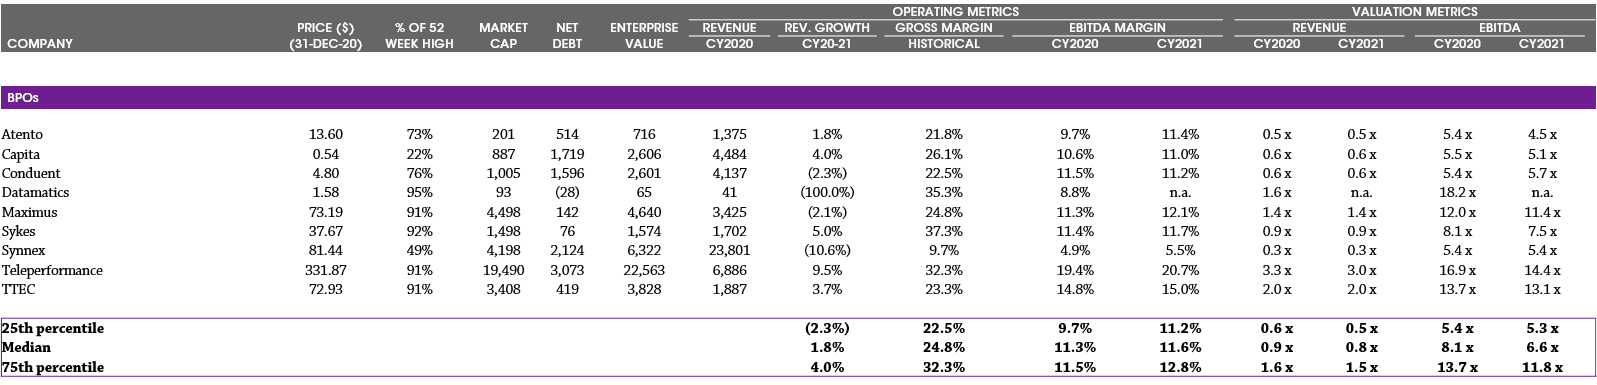
Note: Calendarised to December year end; $ millions, except share price data; multiples capped at 20x EV / Revenue and 50x EV / EBITDA; net debt includes minority interest. Source: Capital IQ