The enterprise software market review: FY 2020
Welcome to the FY 2020 edition of our Enterprise Stack Report – Results International’s full year market update for the enterprise software sector.
Deal activity by both PE and strategic buyers has got off to a fast start in 2021 and, notwithstanding continued uncertainty, we expect demand to remain high for enterprise software businesses. We hope that you enjoy this document and look forward to discussing the data and underlying themes with you. If you are contemplating fundraising, exit or growth through acquisitions, please do get in touch.
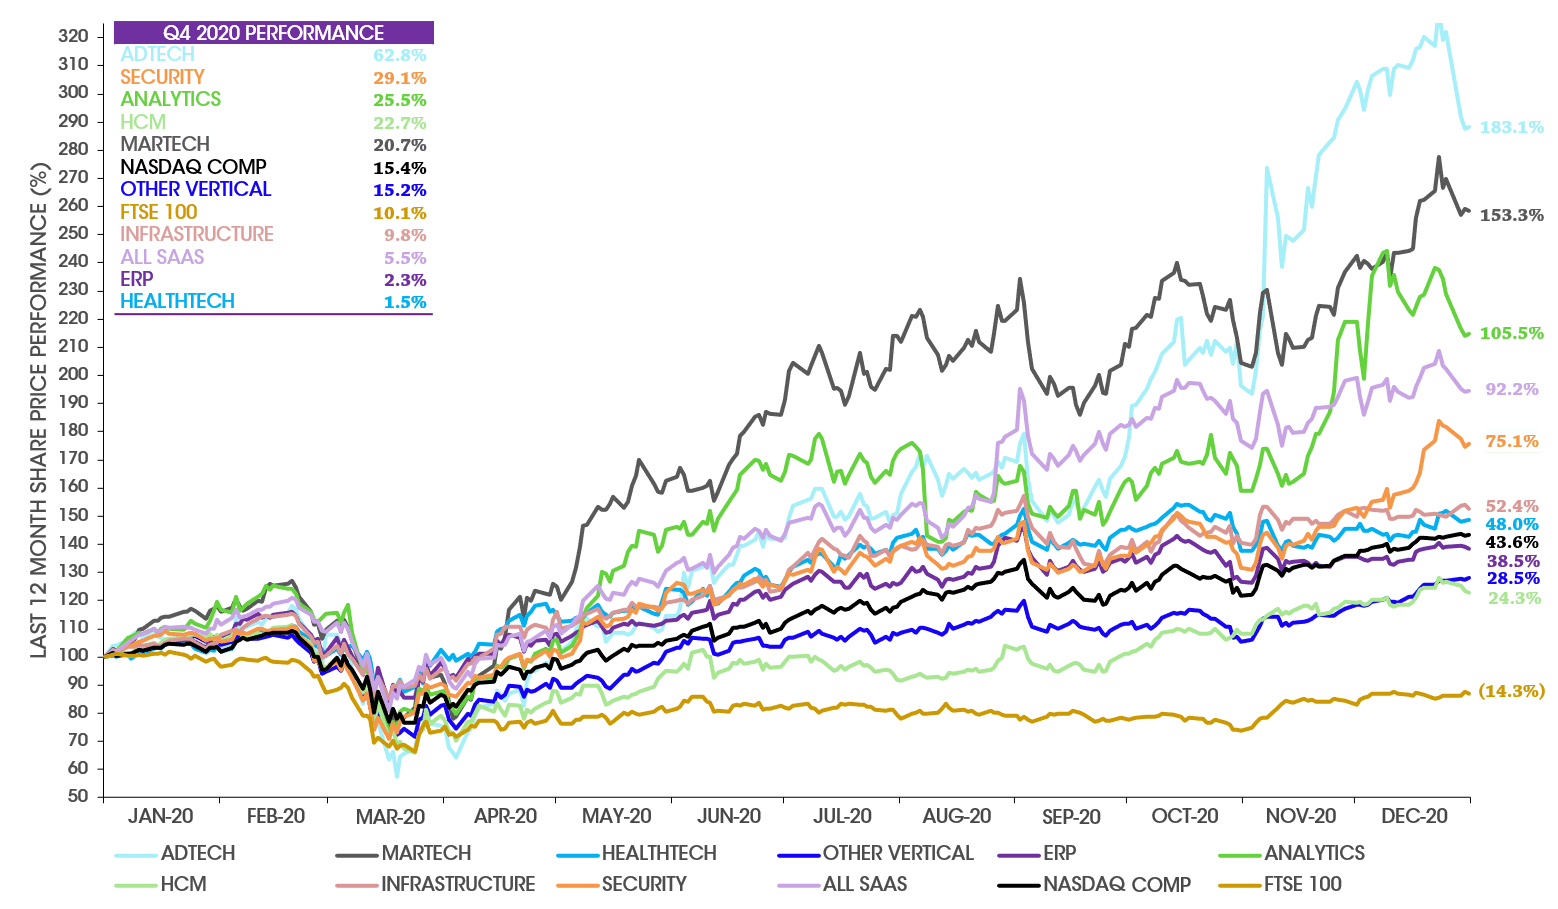
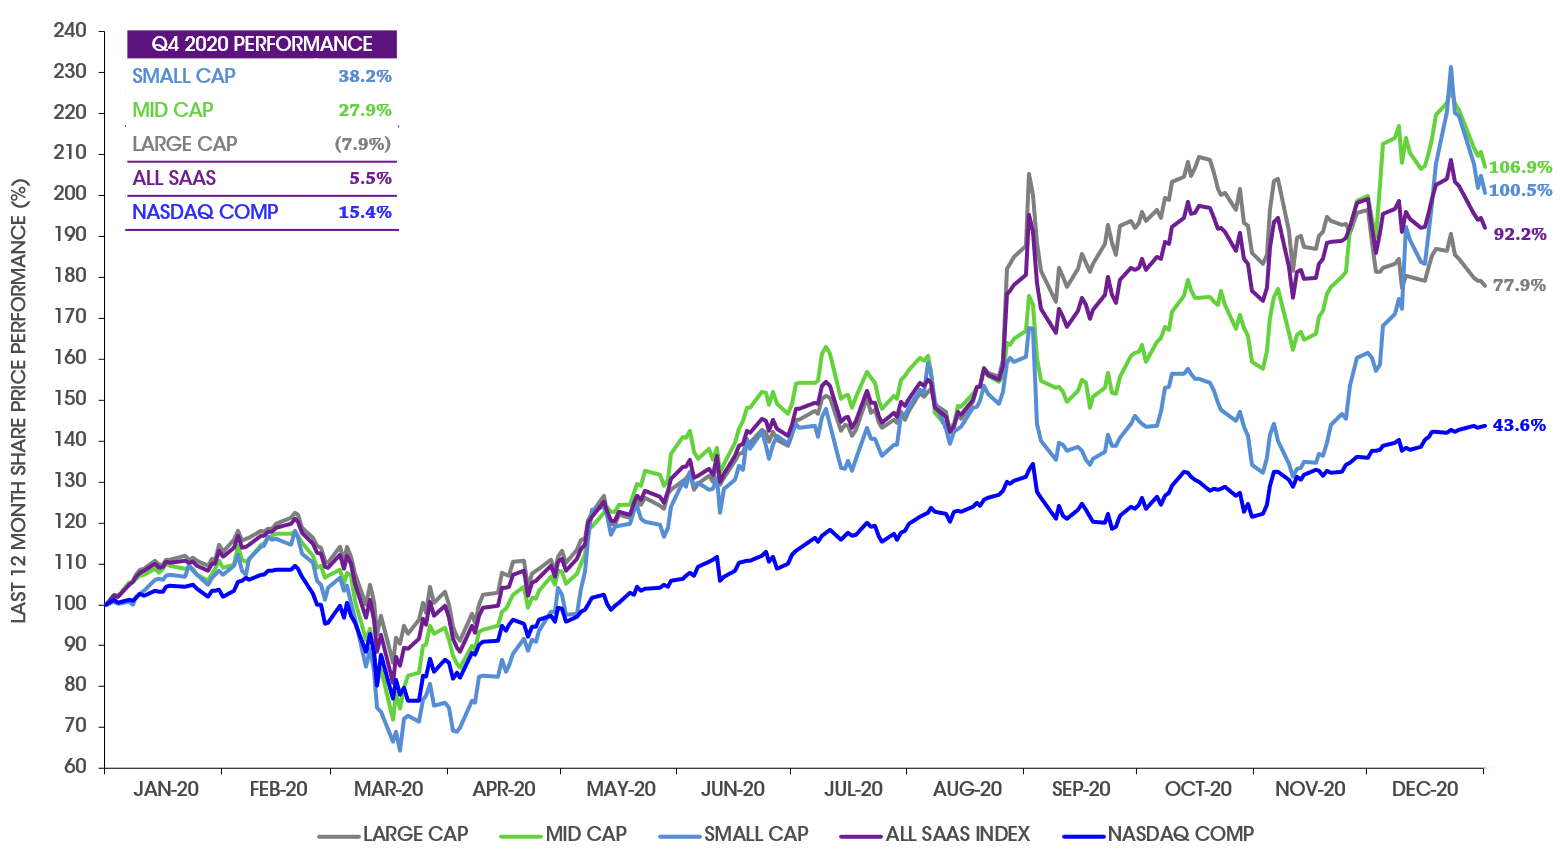
Consistent with technology stocks more generally, listed enterprise software companies performed very strongly in 2020
Our index of pure play SaaS vendors is up 92% in 2020, with all sectors performing well but with the strongest being our adtech, martech and security indices
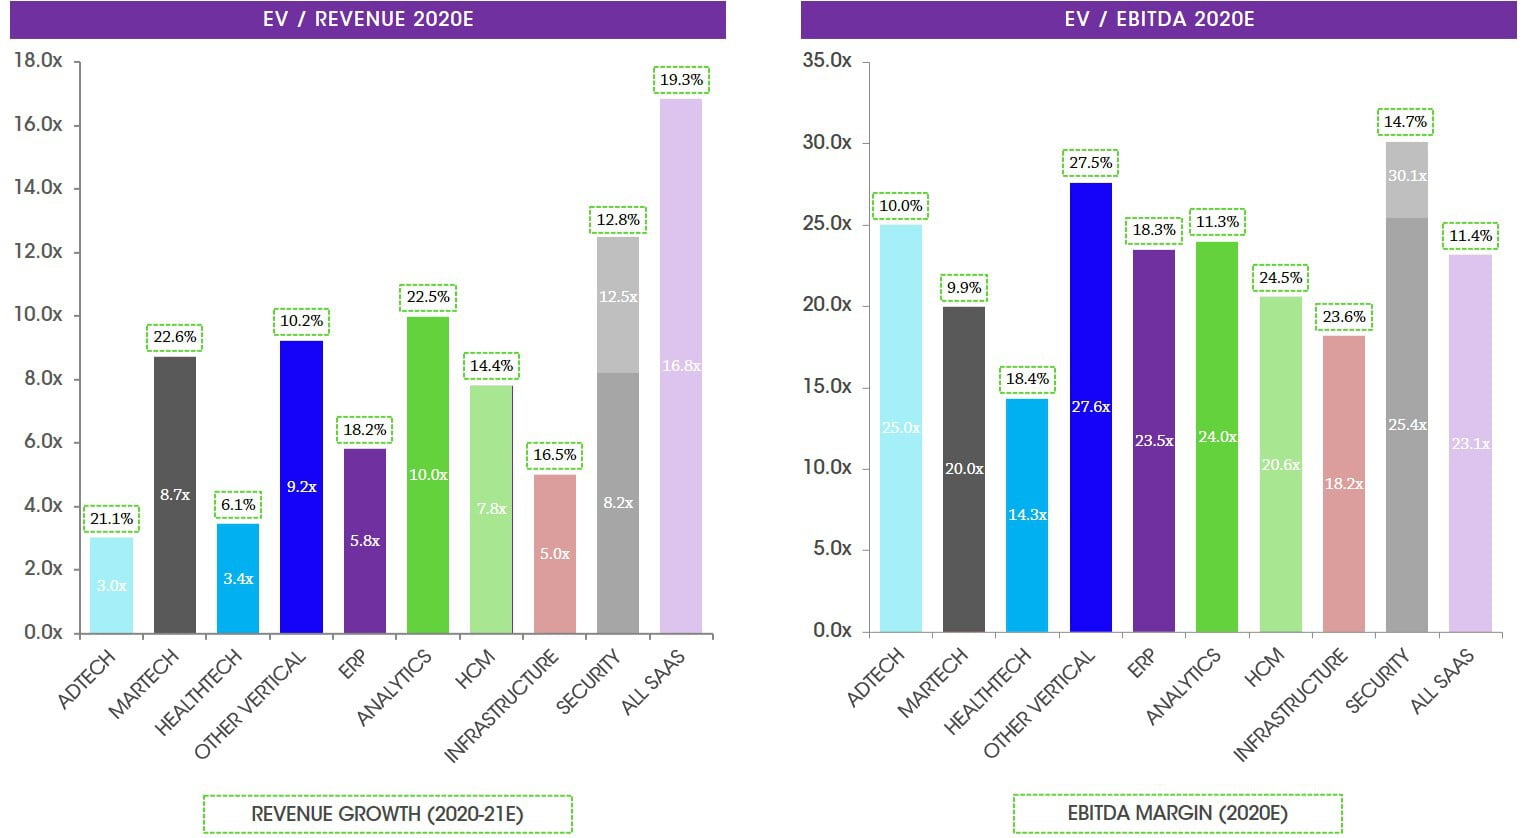
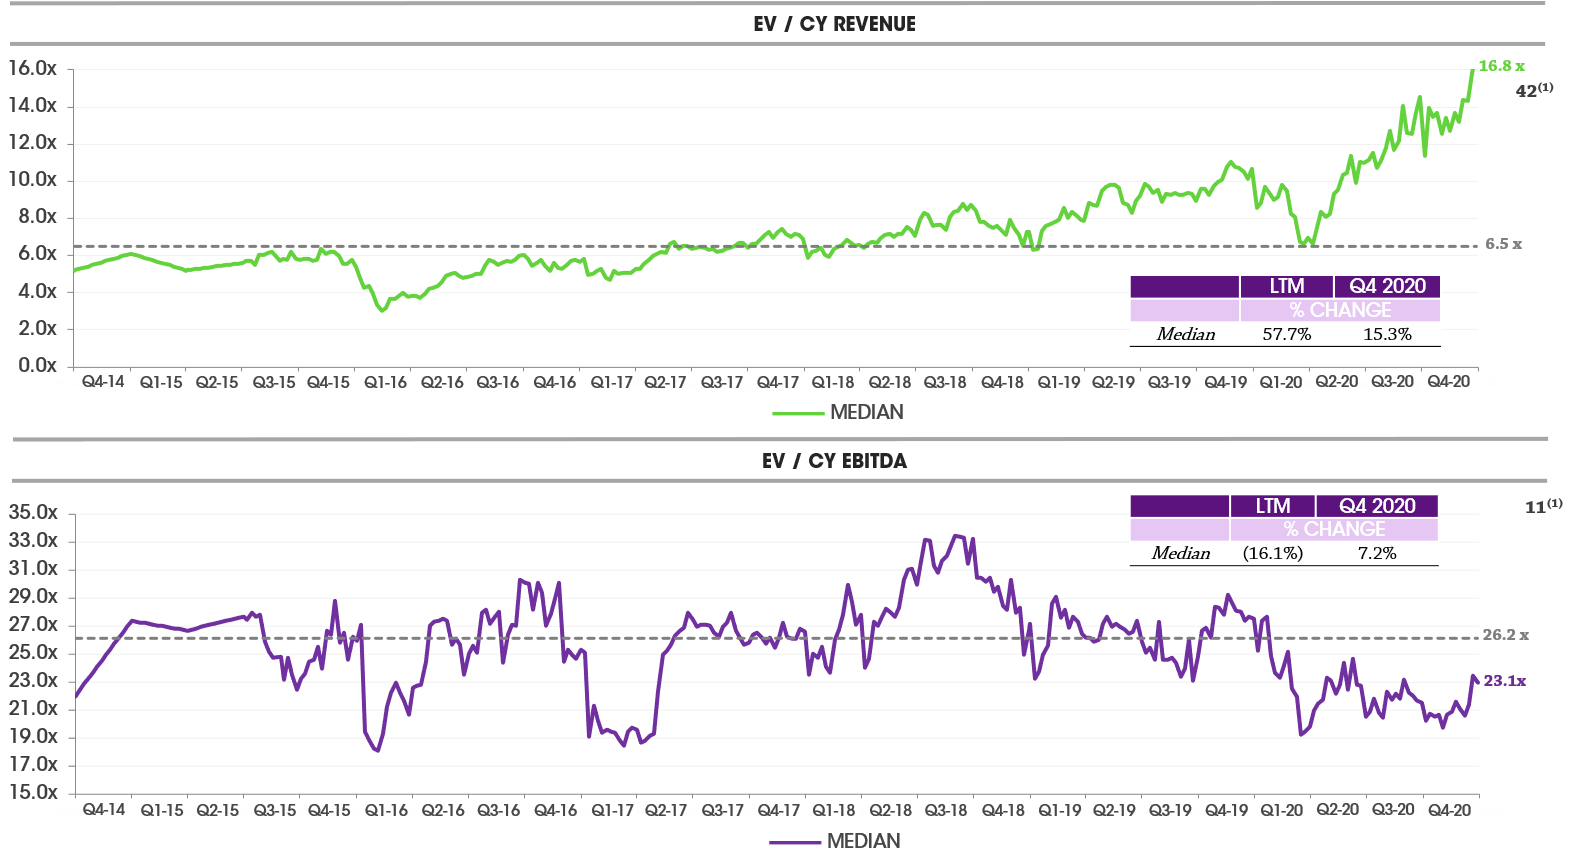
The median EV/Revenue 2020E multiple for our index is at an all-time high of 16.8x. The 6-year median EV/Revenue multiple is 6.5x, however the index has been steadily pulling away from this median since early 2019
Worth noting that the median EV/EBITDA 2020E multiple for our index is 23.1x which, in contrast to the revenue multiple, is below the 6-year median of 26.2x. This reflects the gradual improvement in margin of the listed vendors as they have scaled
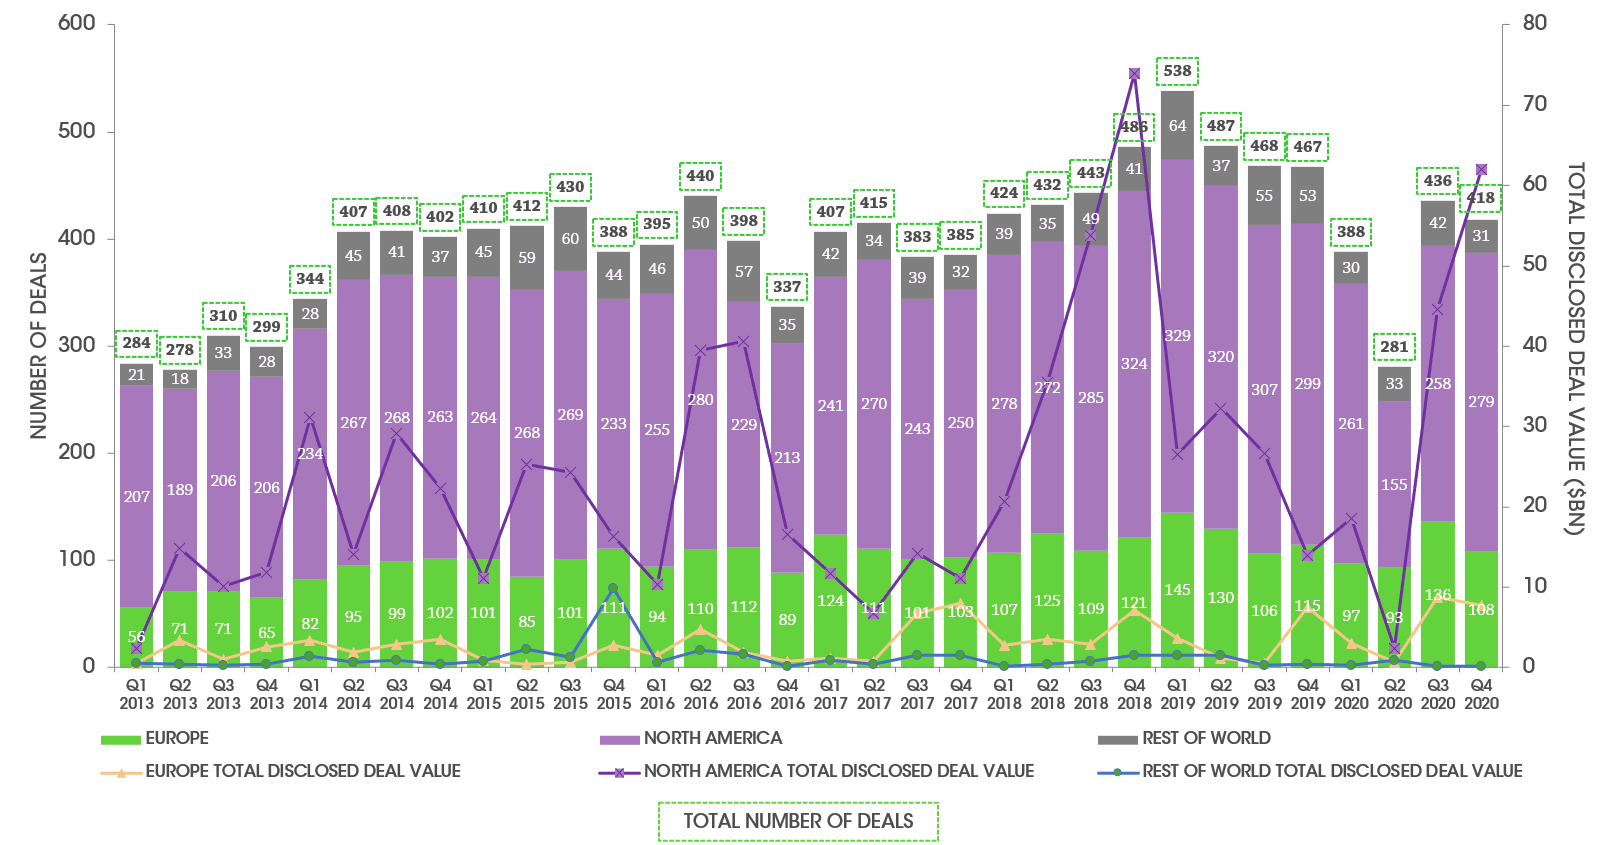
Total deal volume fell to 1,523 in 2020 from 1,960 in the prior year, however this fall was primarily driven by a significant hiatus in deal activity in H1. Deal volumes in H2 2020 were very similar to H2 2019.
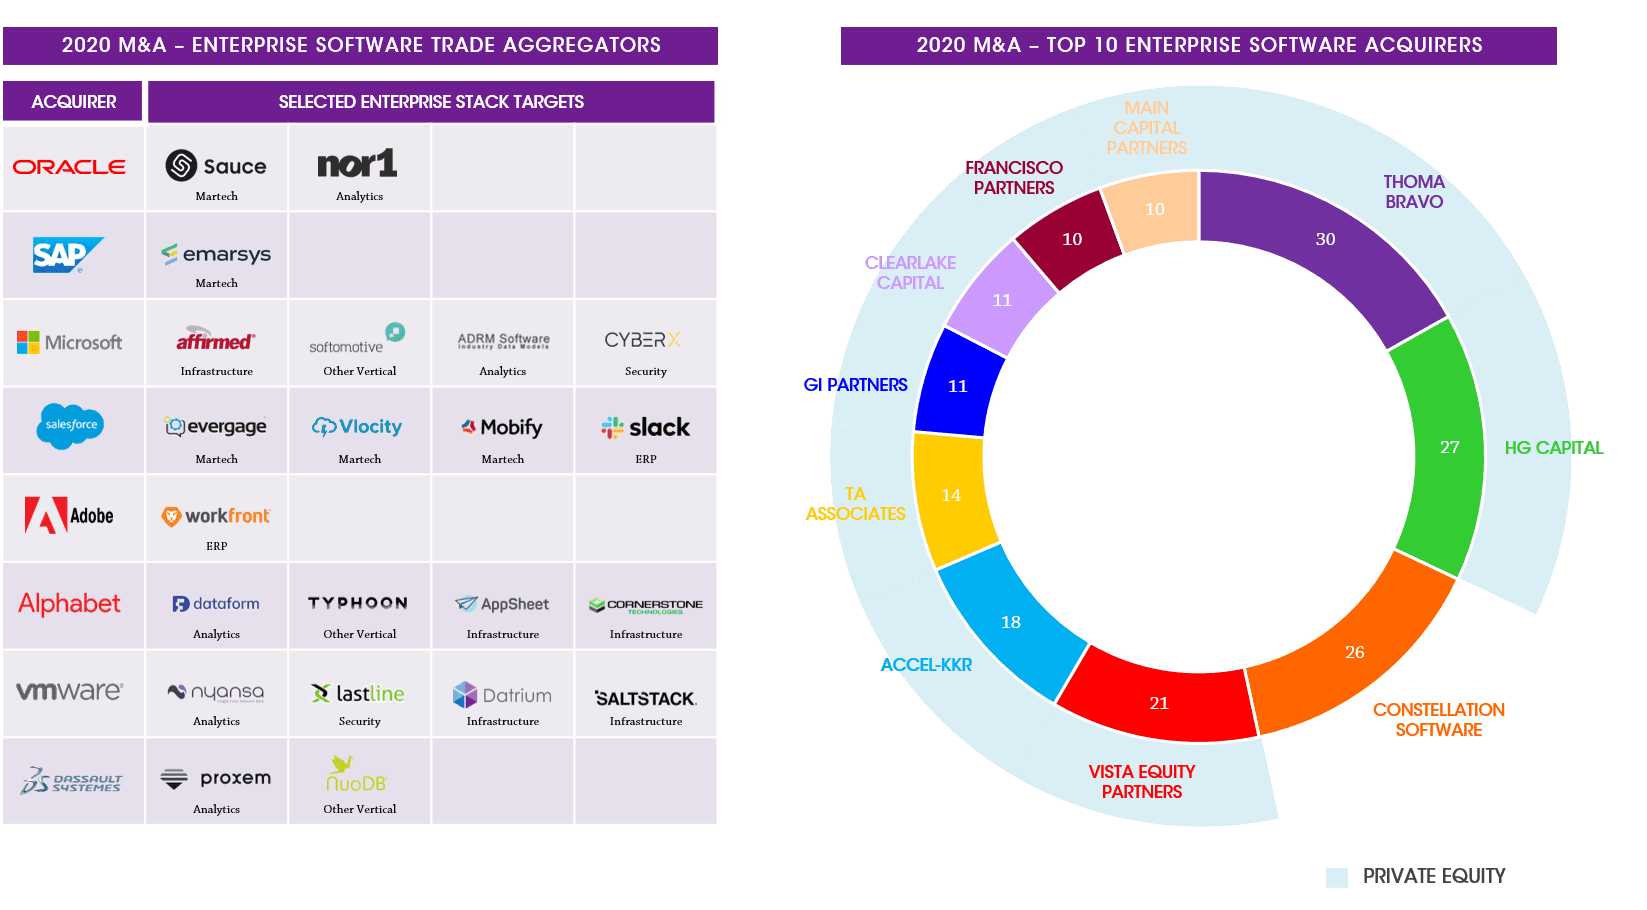
Deal activity has been heavily driven by private equity; four of the five most acquisitive buyers in 2020 were PE firms (Thoma Bravo, HG Capital, Vista and AKKR), investing either directly or via their portfolio companies.
Publicly listed buyers also continue to be active, both the large cap usual suspects, but also increasingly the mid-cap vendors, as they look for growth through acquisition
We continue to see an uptick in interest from US buyers, both listed and PE-backed, in Europe; in some cases driven by technology and in other cases geographic expansion
*Natural Language Processing
Notes: Based on share prices as at 31st December 2020; indices weighted by market capitalisation. Sources: Capital IQ and Results International analysis.
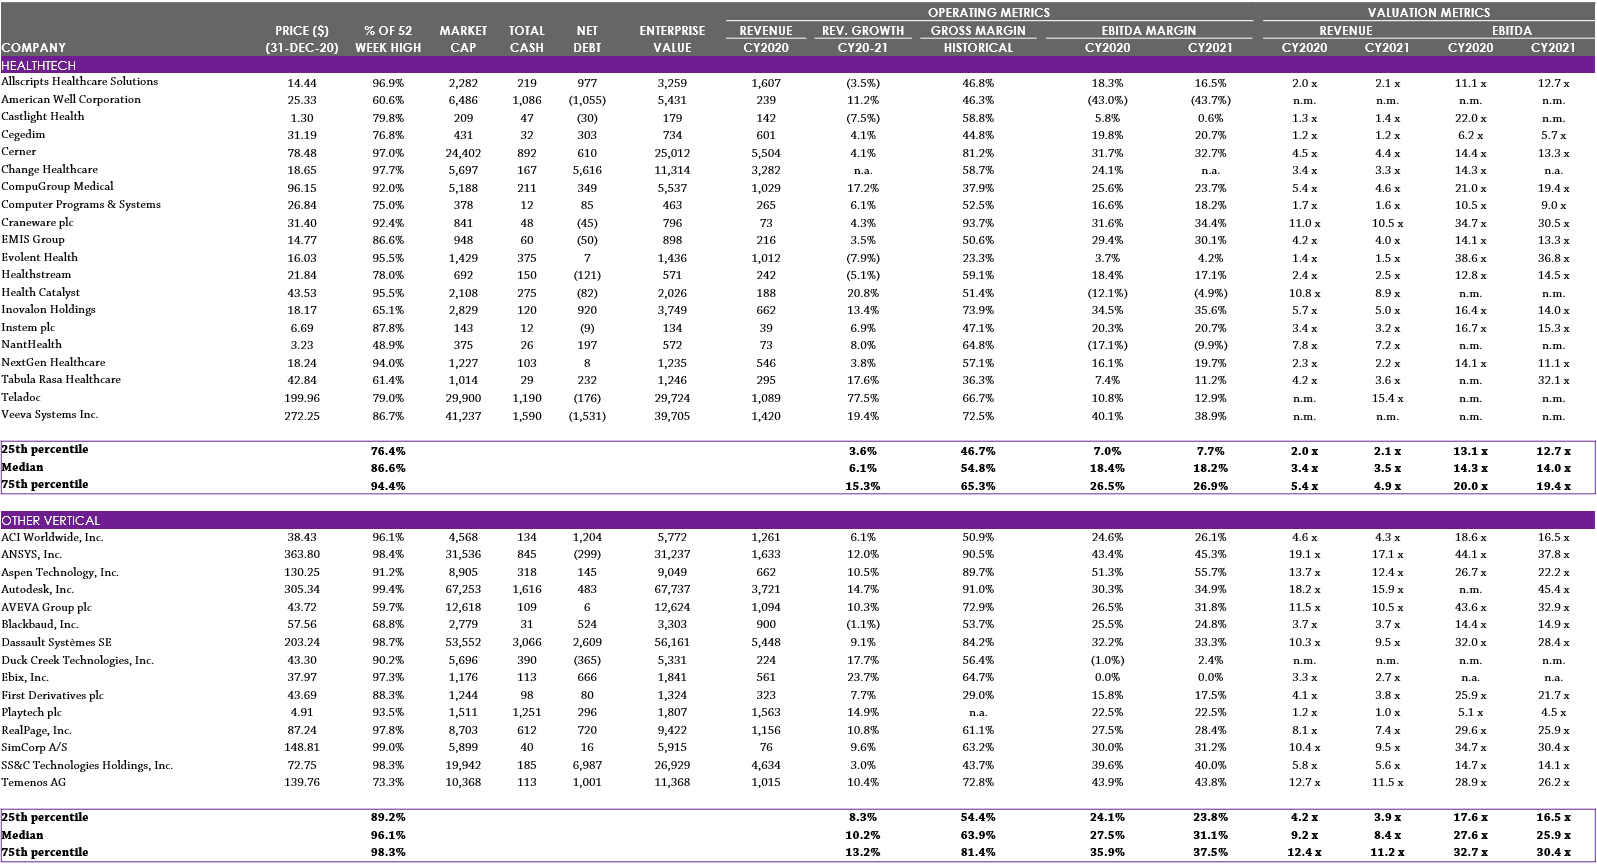
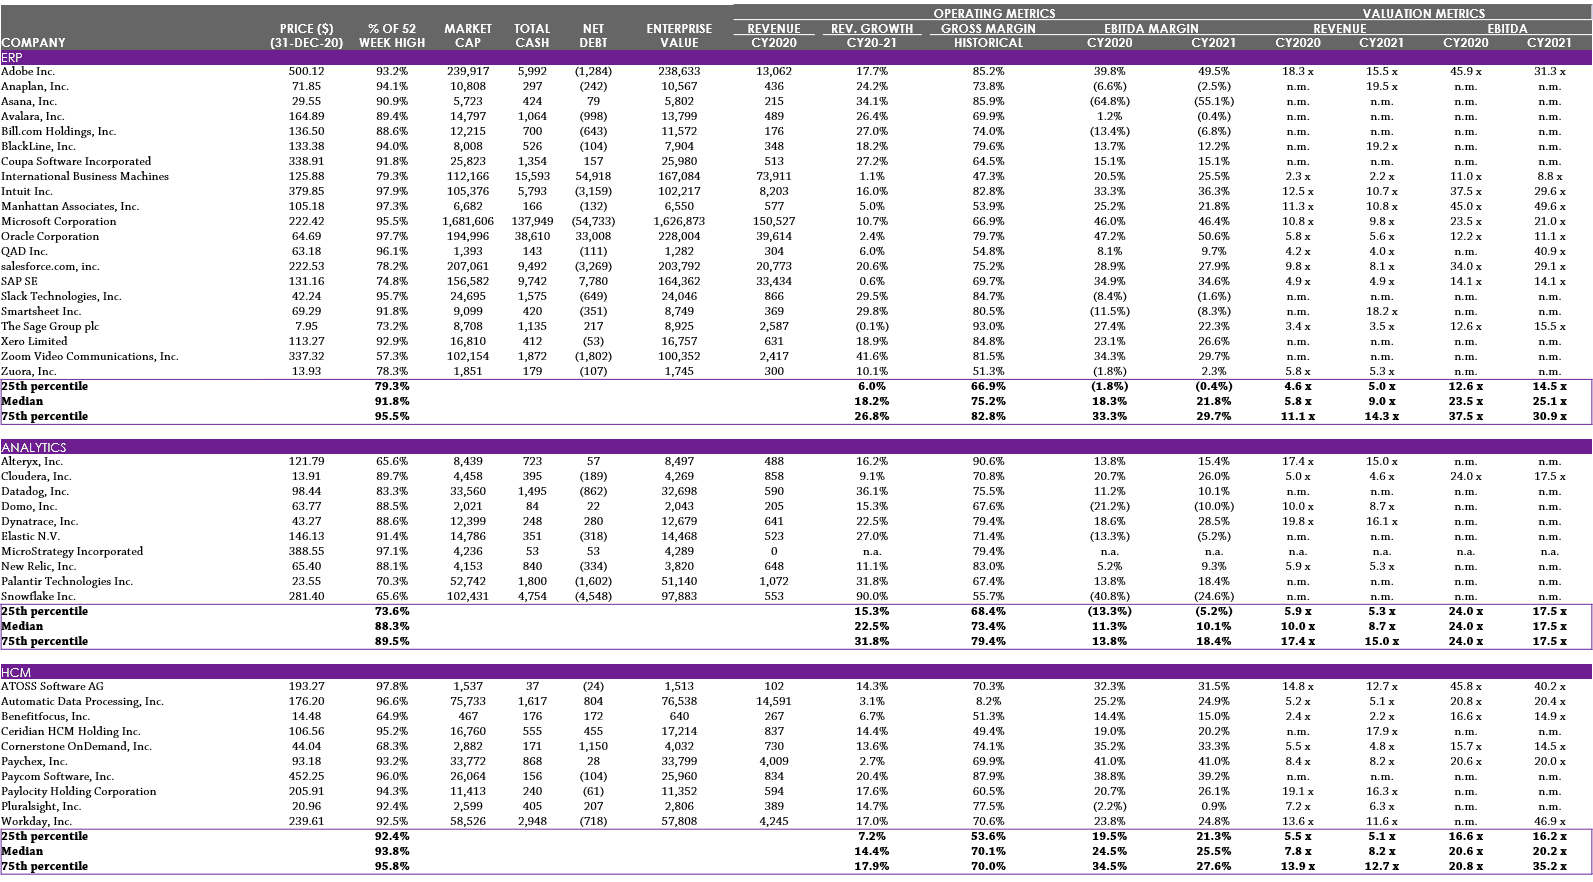
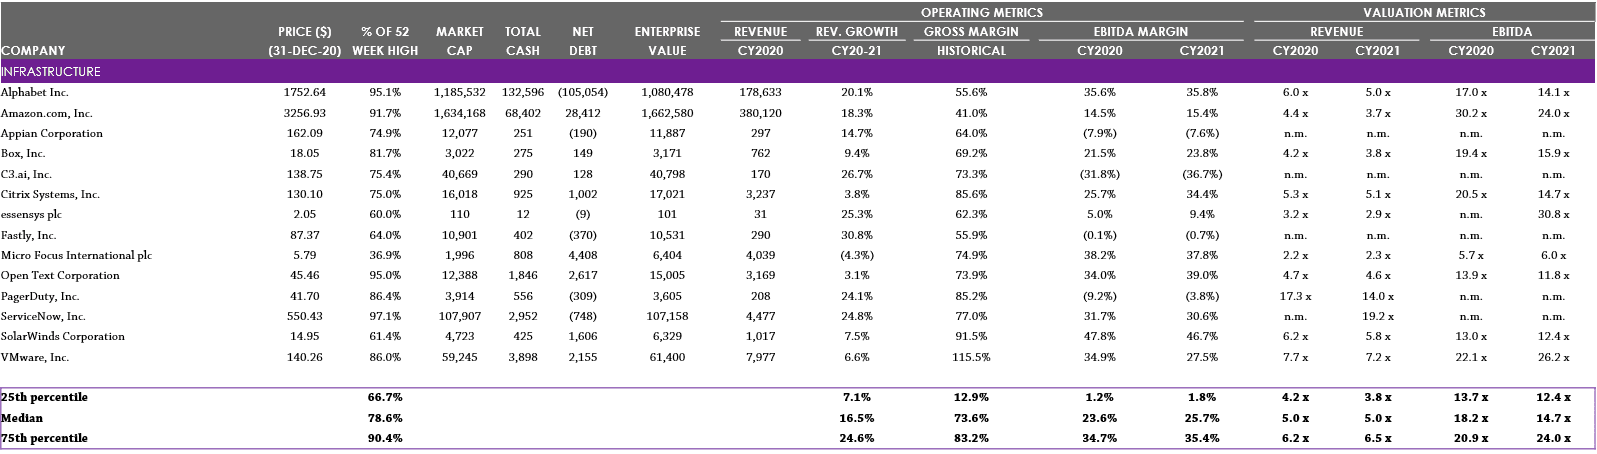
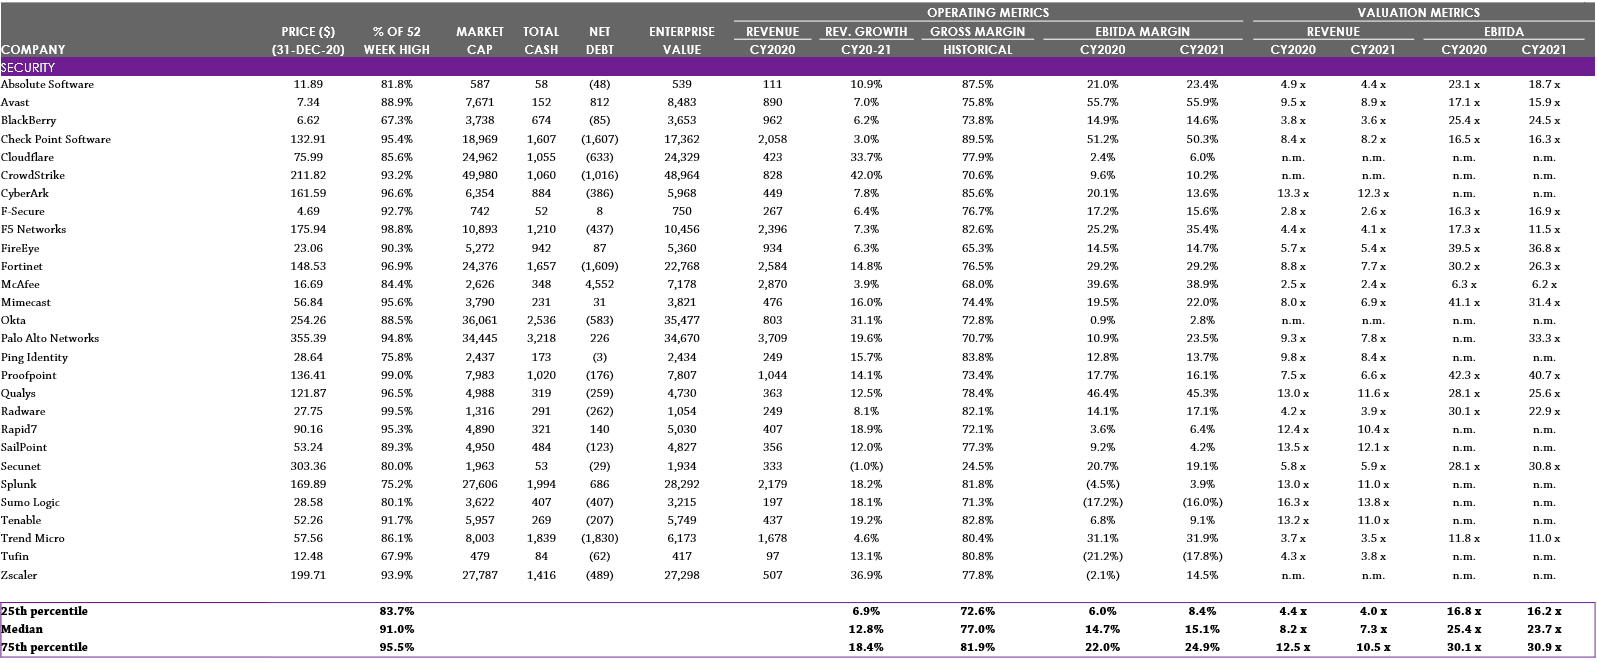
Note: For Security, 75th percentile values have been overlaid (shaded lighter) to illustrate next-generation vendors. Note: EV = Enterprise Value; financials calendarised to December year end; median values reported. See Selected Publicly Traded Companies (click here) for details of companies included in each category. Source: Capital IQ
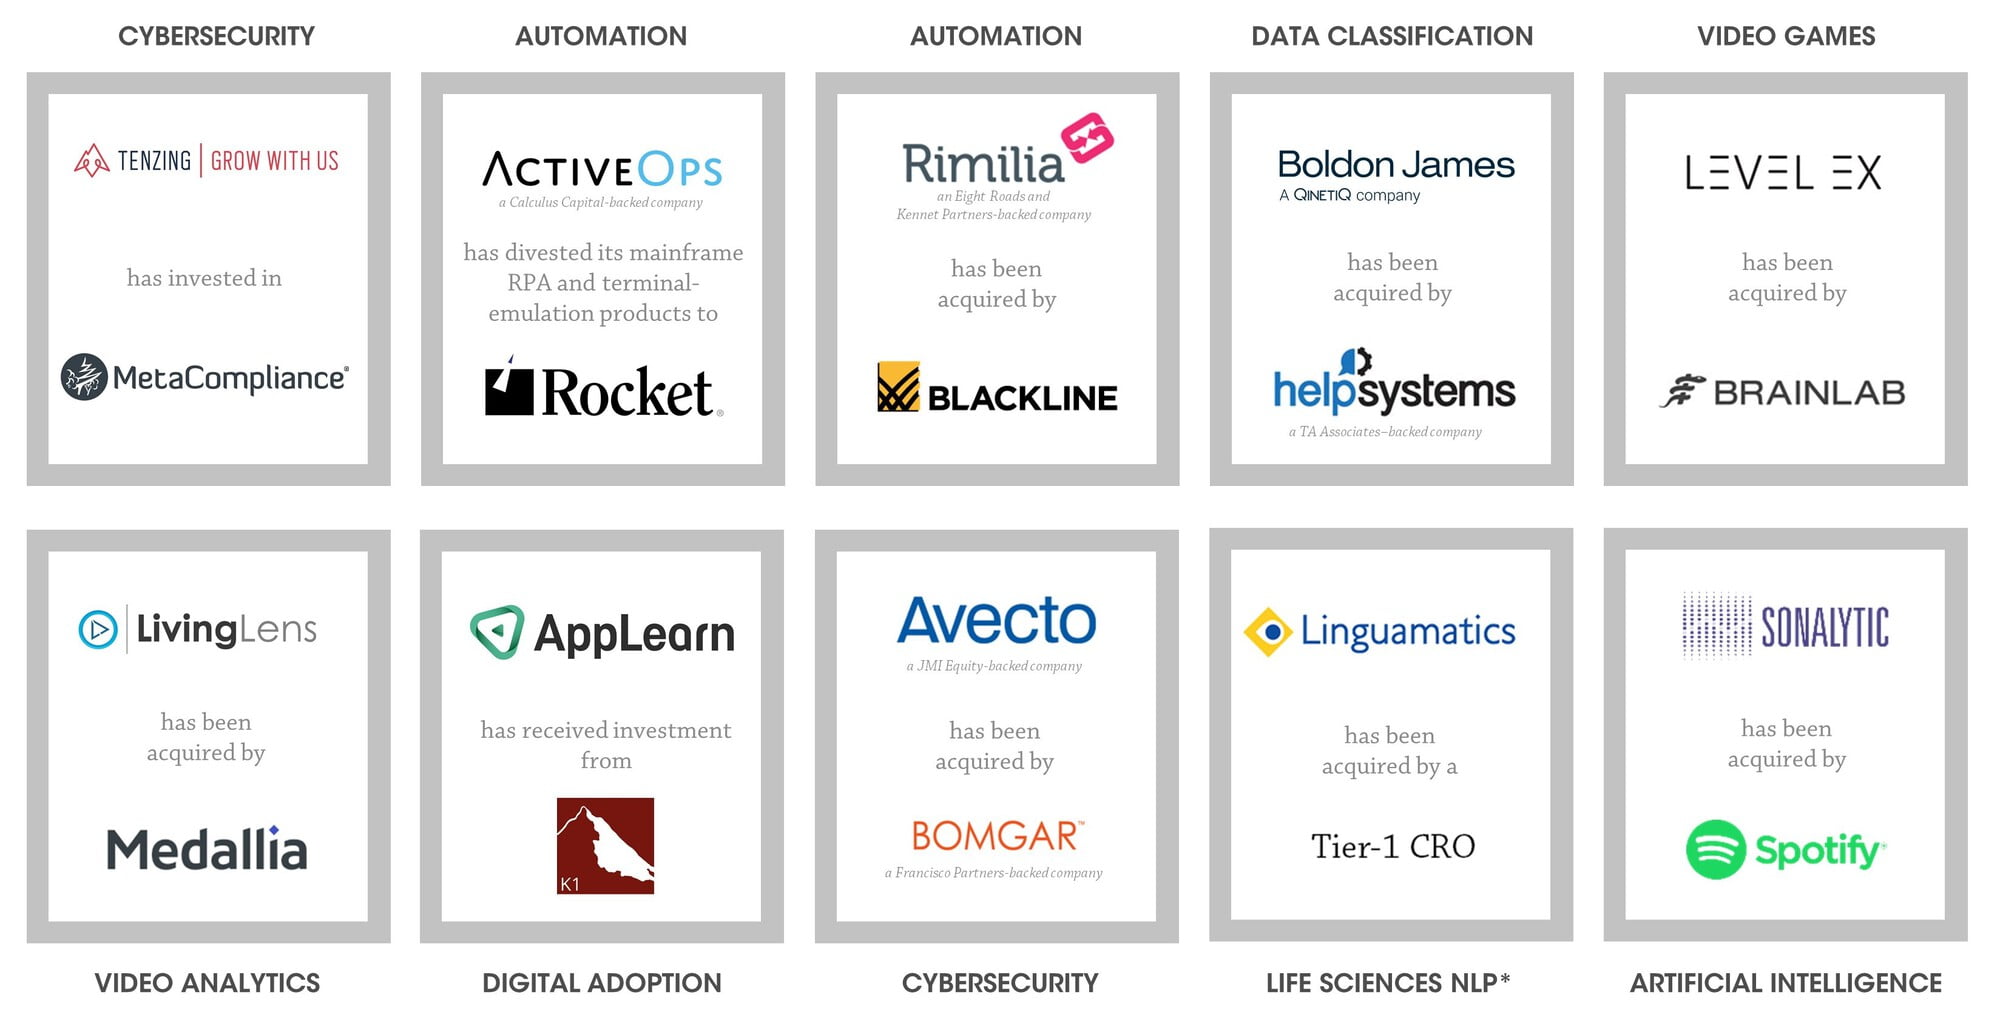
Sources: Press releases, Capital IQ, Mergermarket, 451 Research and Results International analysis.
Note: PE also shown as acquirer when acquisitions made through portfolio company; parent also shown as acquirer when acquisition made through group subsidiary/ group. Sources: Press releases, Capital IQ, Mergermarket, 451 Research and Results International analysis.
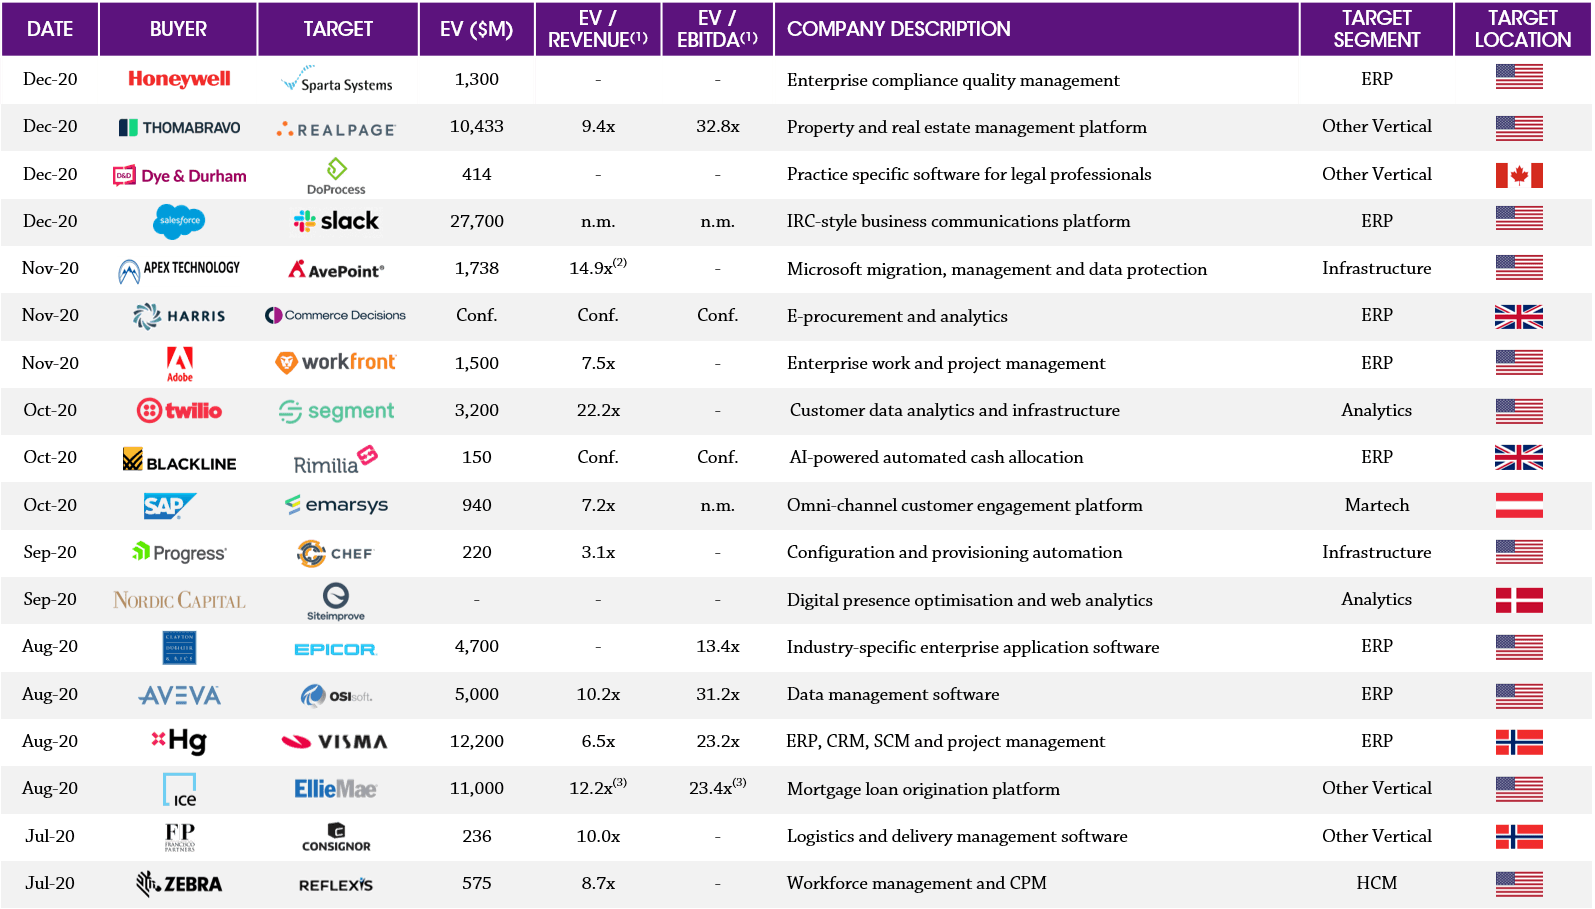
(1) In certain cases EV/Revenue and EV/EBITDA are publicly reported estimates; TTM financials have been used where possible; EV = transaction value scaled to 100% shareholding plus net debt (incl. minority interest) (2) Based on 451 estimates (3) Based on FY20 projected financials. Note: Earnout considerations excluded in the calculation of Enterprise Value. Sources: Press releases, 451 Research and Results International analysis.
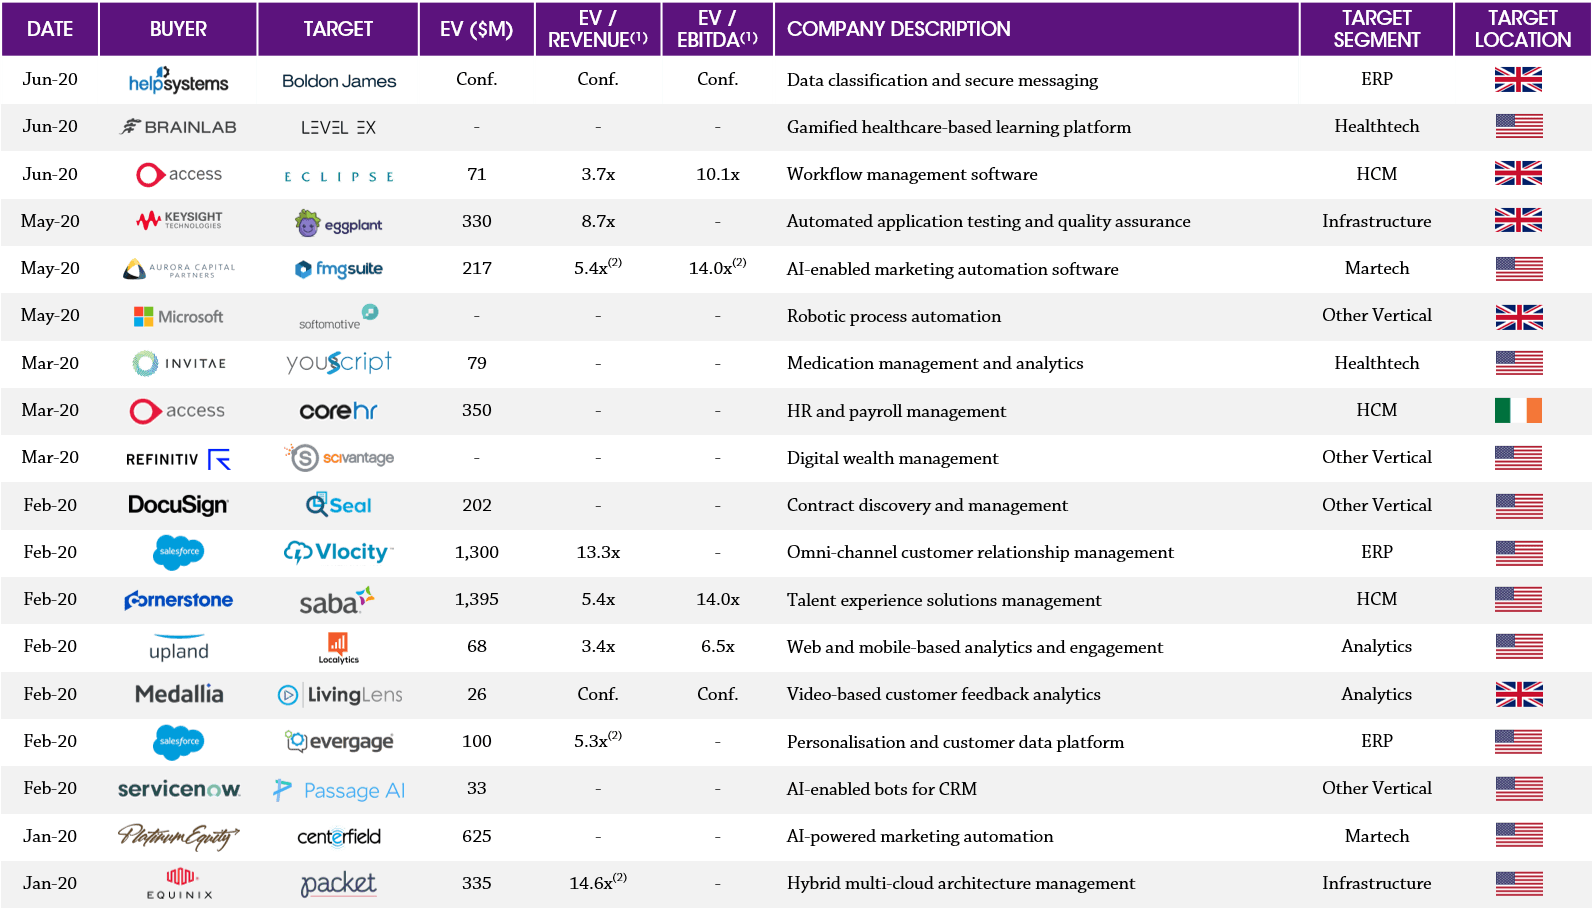
(1) In certain cases EV/Revenue and EV/EBITDA are publicly reported estimates; TTM financials have been used where possible; EV = transaction value scaled to 100% shareholding plus net debt (incl. minority interest) (2) Based on 451 estimates. Note: Earnout considerations excluded in the calculation of Enterprise Value. Sources: Press releases, 451 Research and Results International analysis
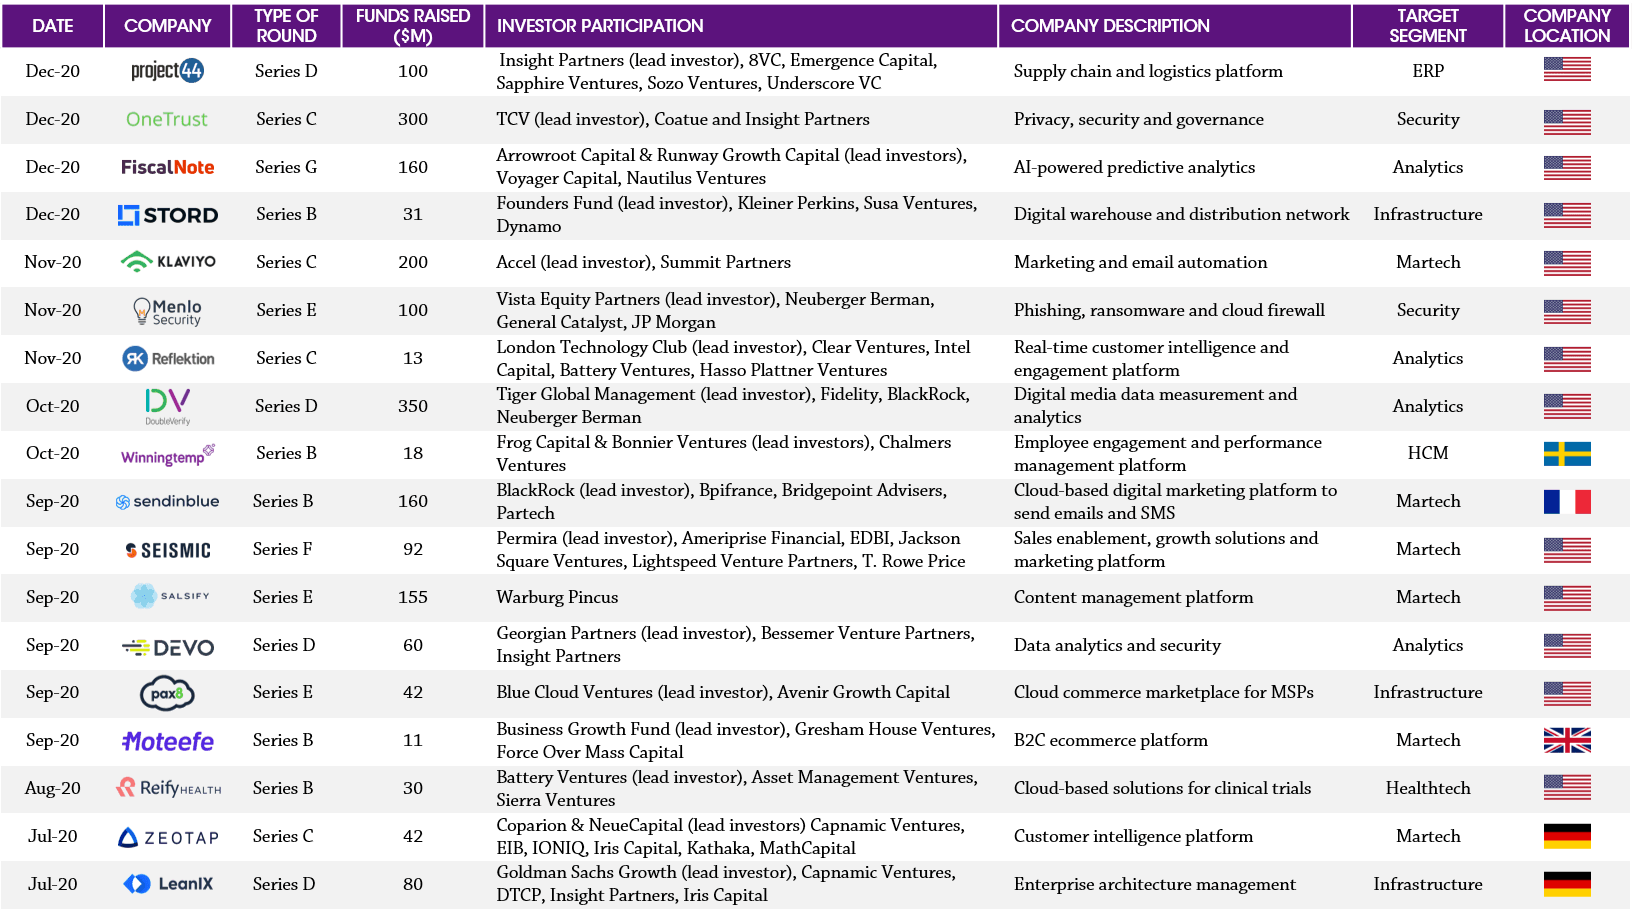
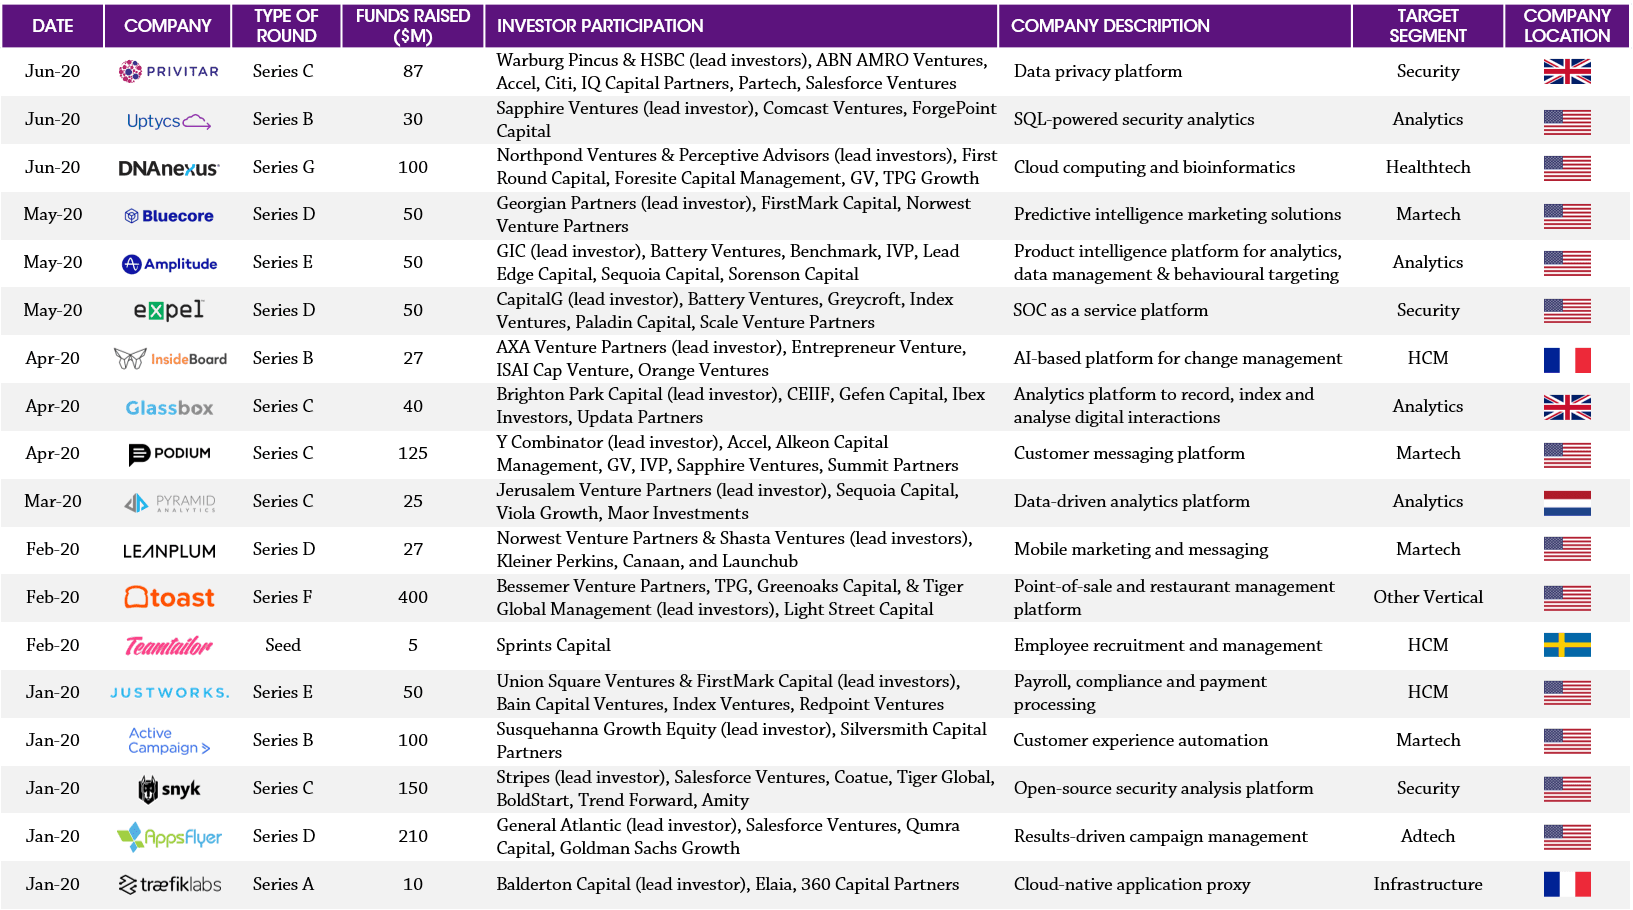
Sources: Pitchbook, Press releases, Crunchbase and Results International analysis
Notes: Based on share prices as at 31st December 2020; indices weighted by market capitalisation. Sources: Capital IQ and Results International analysis
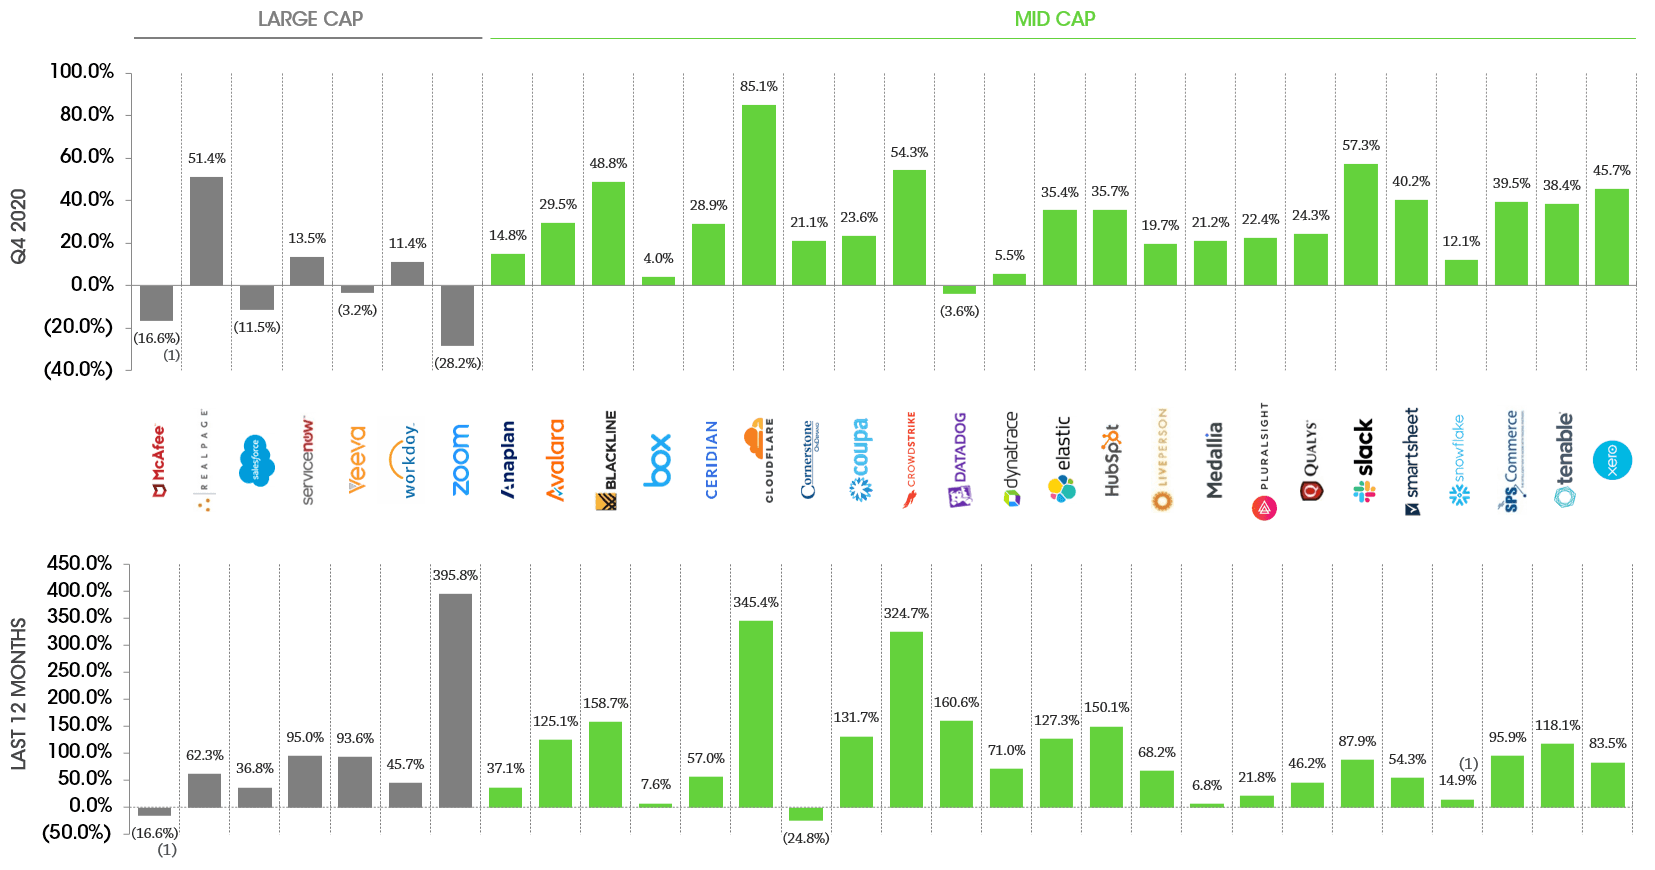
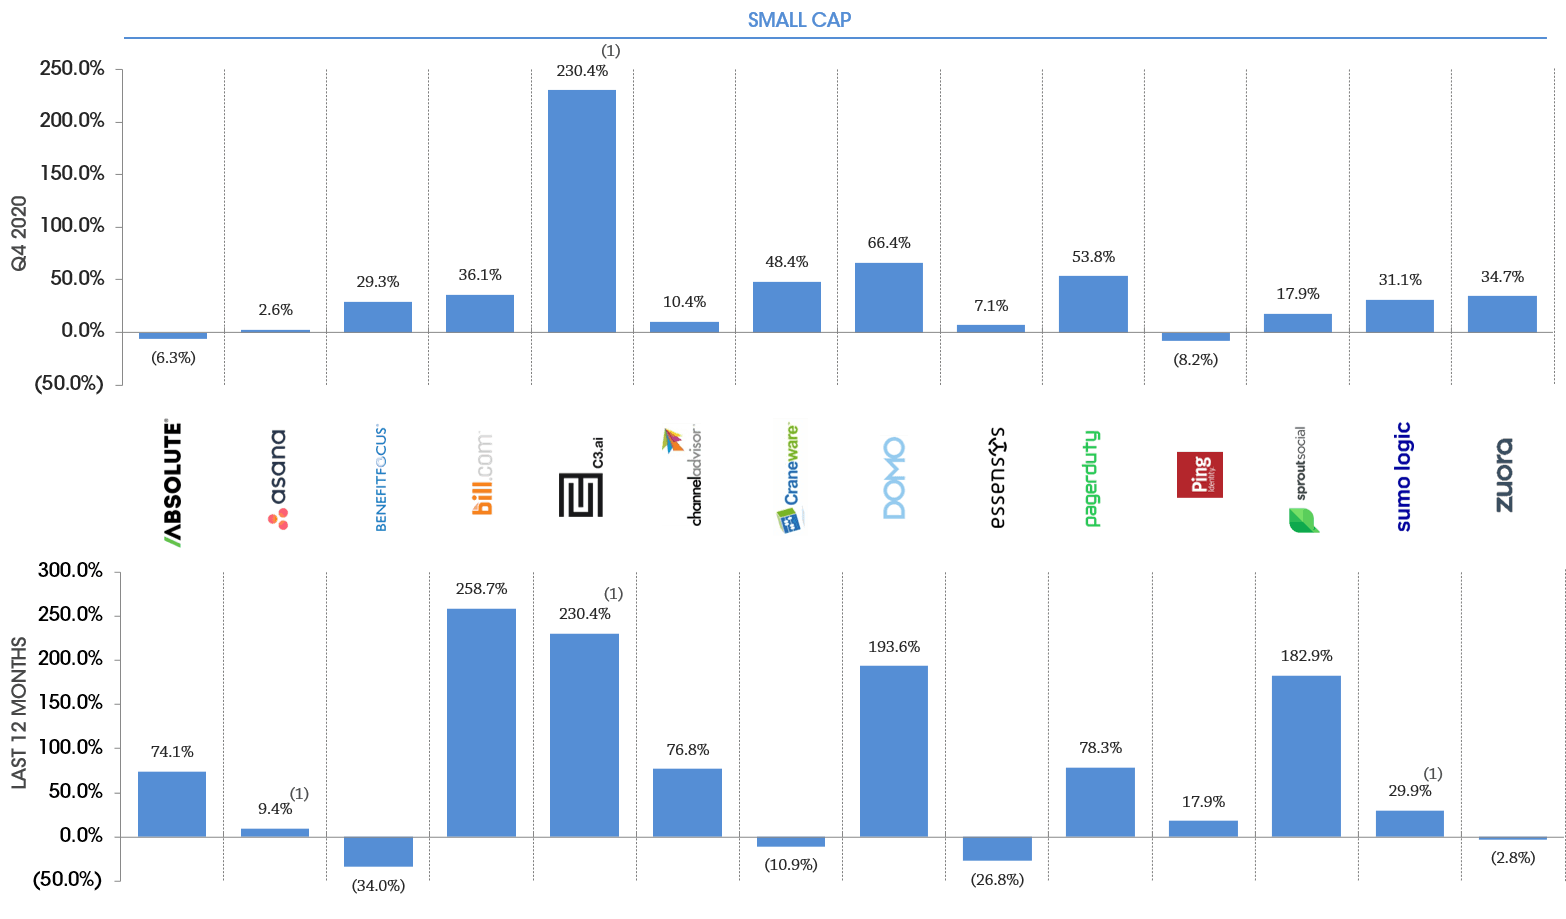
(1) These companies IPO’d within the last 12 months/last quarter, the share price movement represents the change between the stock’s IPO date and 31st December 2020. Note: Based on share prices as at 31st December 2020. Sources: Capital IQ and Results International analysis.
(1) These companies IPO’d within the last 12 months /last quarter, the share price movement represents the change between the stock’s IPO date and 31st December 2020. Note: Based on share prices as at 31st December 2020. Sources: Capital IQ and Results International analysis
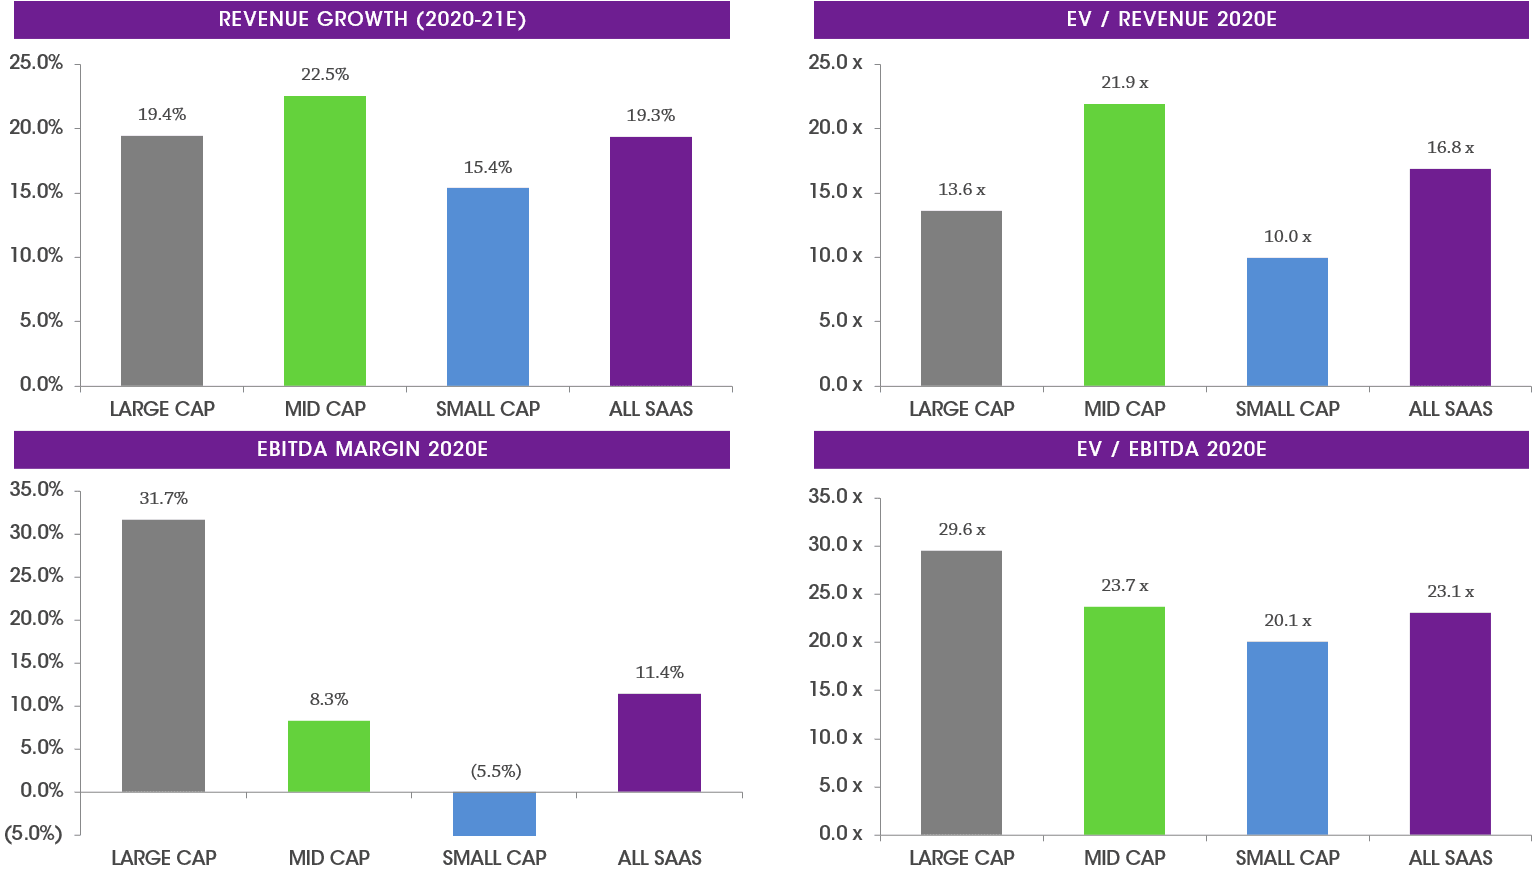
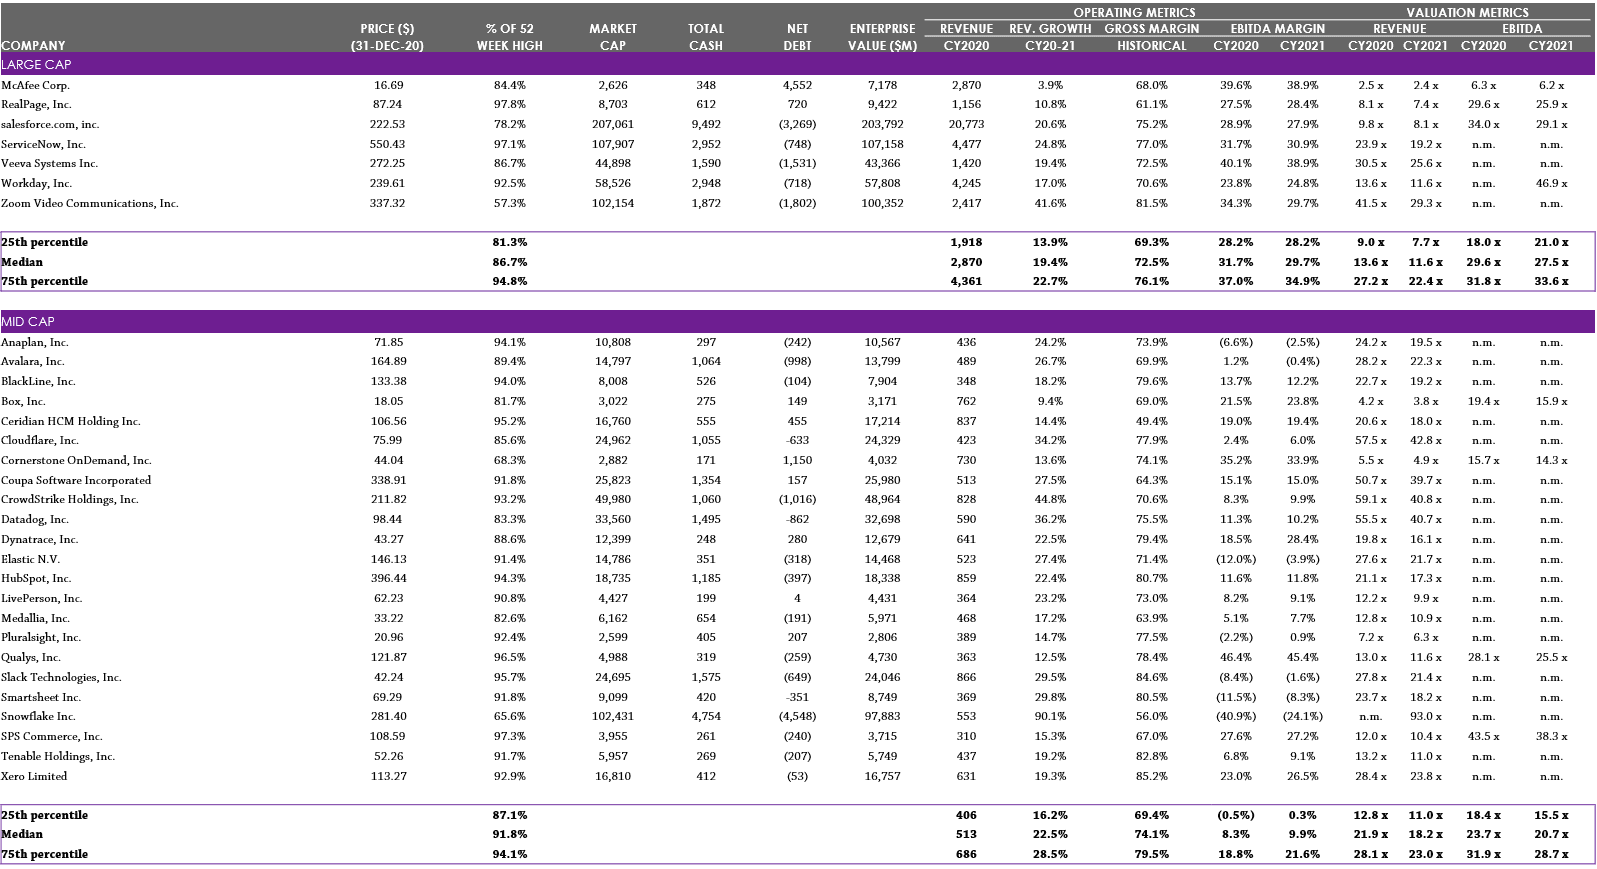
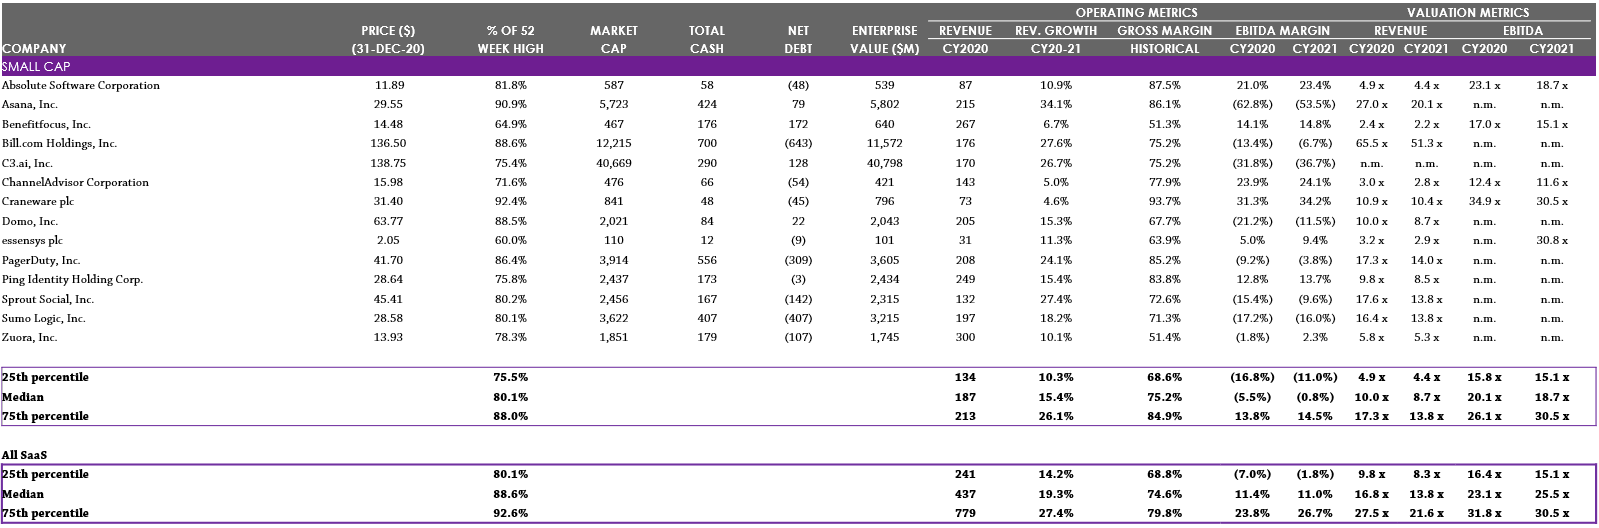
1) All SaaS represents the median of all stocks in Large Cap, Mid Cap and Small Cap, with no weighting applied. Notes: EV = Enterprise Value; financials calendarised to December year end; median values reported. See Selected Publicly Traded Companies (click here) for details of companies included in each category. Sources: Capital IQ and analyst reports.
(1) Number of companies with applicable multiples in Q4 2020 index. Notes: EV = Enterprise Value; financials calendarised to December year end, which can impact the multiples at the start of each year as the base is shifted forward; weekly tracking of valuation multiples commenced in July 2015, October 2014 – June 2015 tracked on a quarterly basis, therefore a linear progression has been assumed between quarters up to July 2015. Dotted line represents median since data has been tracked. Source: Capital IQ
Note: Calendarised to December year end; $ millions, except share price data; multiples capped at 20x EV / Revenue and 50x EV / EBITDA; net debt includes minority interest. Source: Capital IQ.
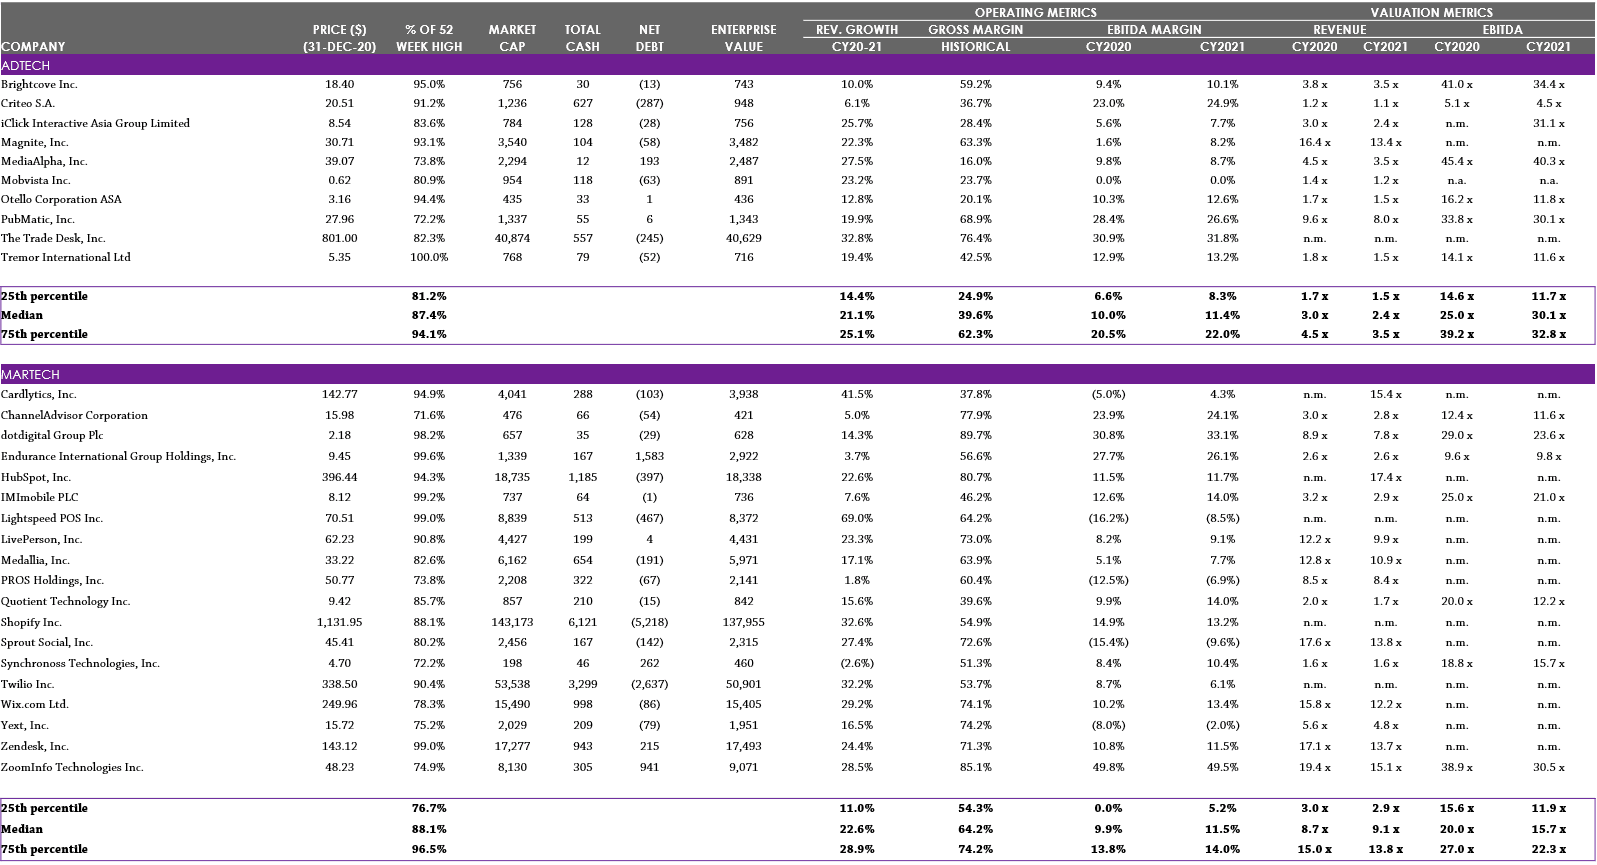
Note: Calendarised to December year end; $ millions, except share price data; multiples capped at 25x EV / Revenue and 50x EV / EBITDA; net debt includes minority interest. Source: Capital IQ.
Note: Calendarised to December year end; $ millions, except share price data; multiples capped at 100x EV / Revenue and 50x EV / EBITDA; net debt includes minority interest. Note: Market cap classifications categorised by CY2020E revenue: Large Cap: revenues greater than $900m; Mid Cap: revenues between $300m and $900m; Small Cap: revenues less than $300m. Source: Capital IQ, broker reports.
Note: Calendarised to December year end; $ millions, except share price data; multiples capped at 25x EV / Revenue and 50x EV / EBITDA; net debt includes minority interest. Note: Market cap classifications categorised by CY2020E revenue: Large Cap: revenues greater than $900m; Mid Cap: revenues between $300m and $900m; Small Cap: revenues less than $300m. Source: Capital IQ, broker reports.