The enterprise software market review: Q1 2021
Welcome to the Q1 2021 edition of our Enterprise Stack Report – Results International’s quarterly market update for the enterprise software sector.
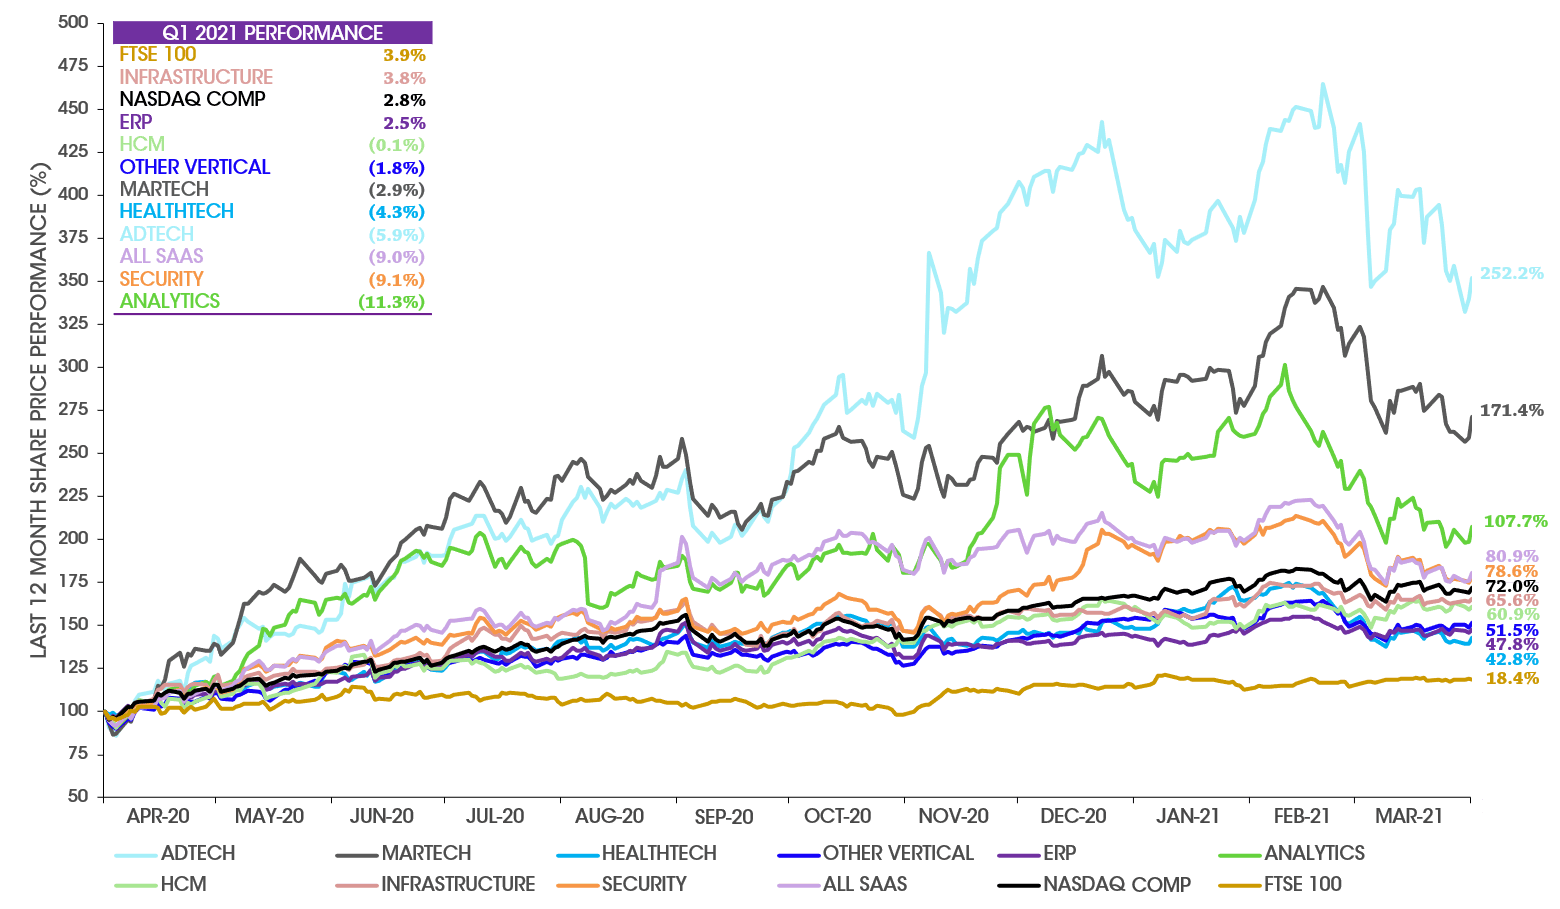
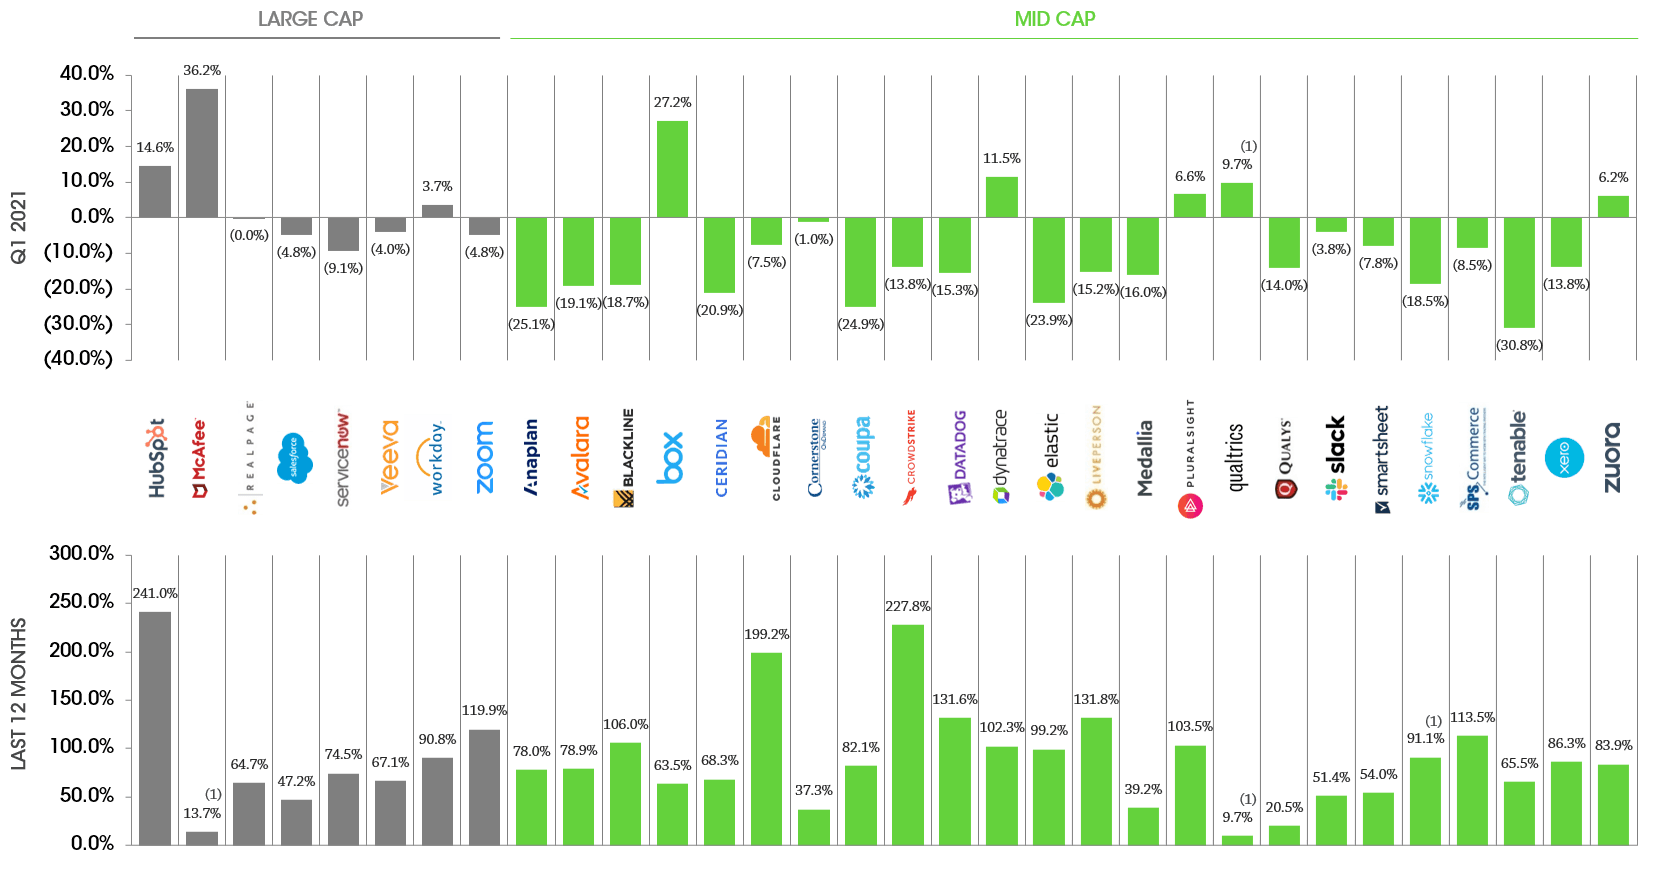
Although valuations remain strong, our index of listed enterprise software companies on aggregate experienced its weakest quarter since Q1 2020
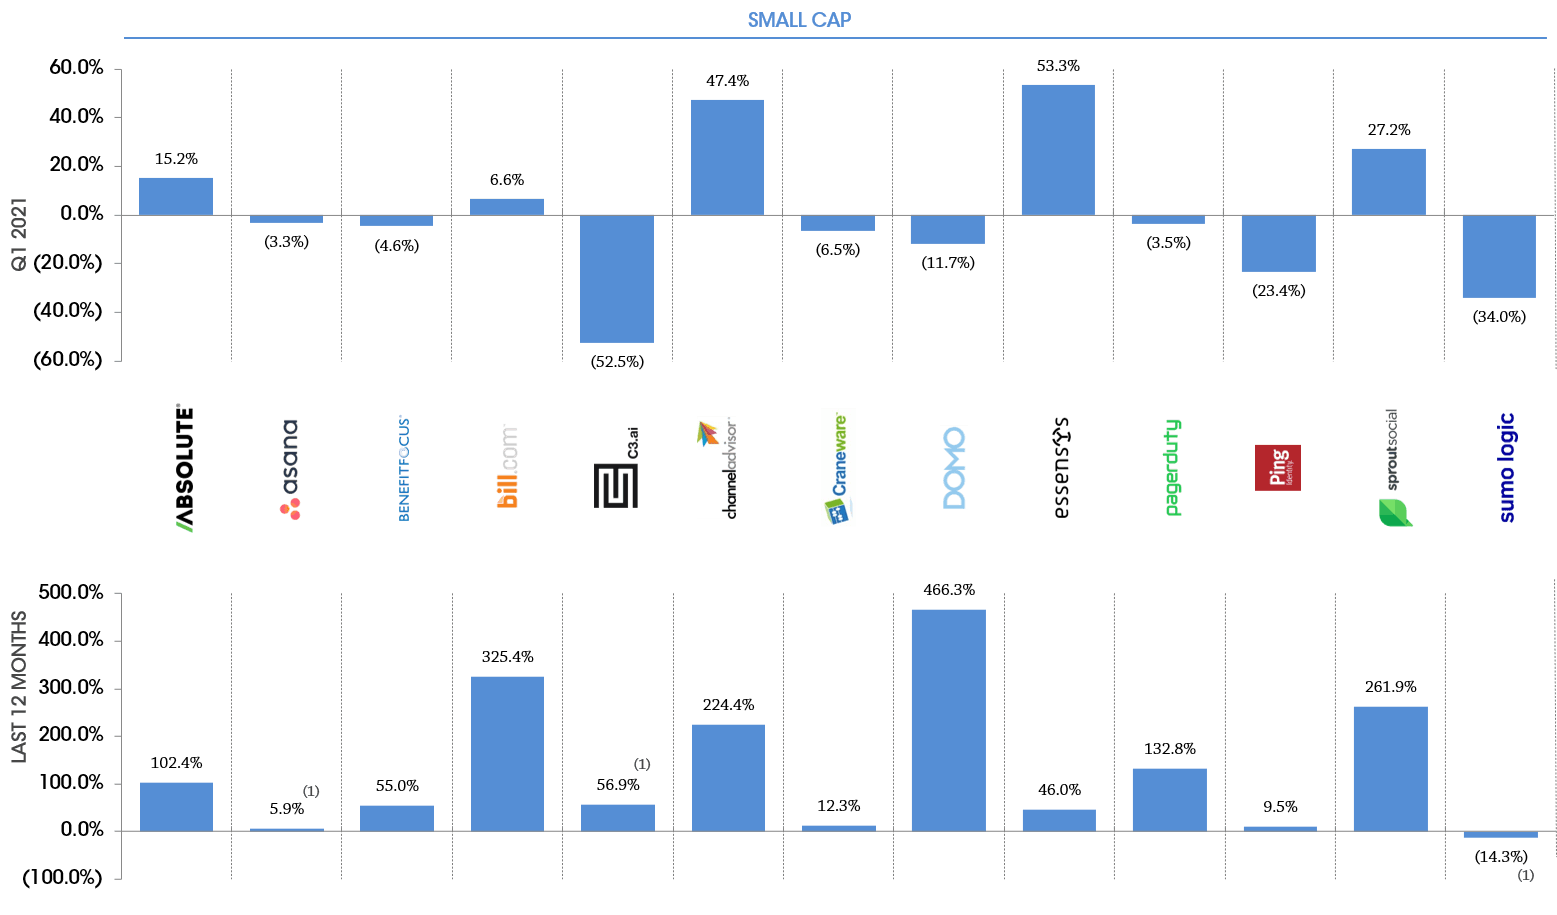
Our index of Pure Play SaaS vendors is down 9.0% in Q1 (despite a 92% increase through FY 2020); although as always there have been some outliers and companies including Hubspot, McAfee, Box and Channel Advisor performed strongly
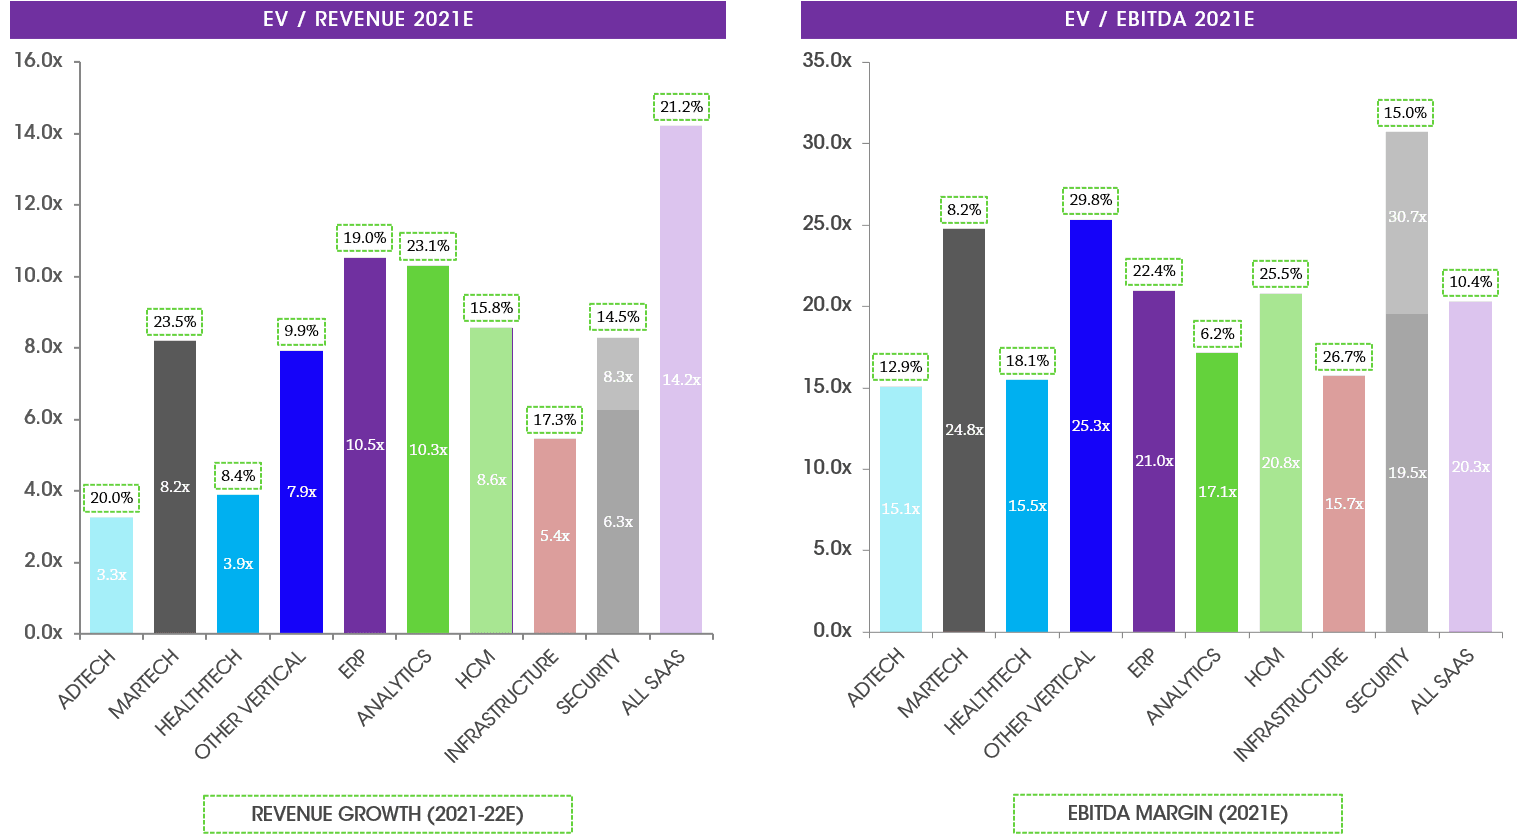
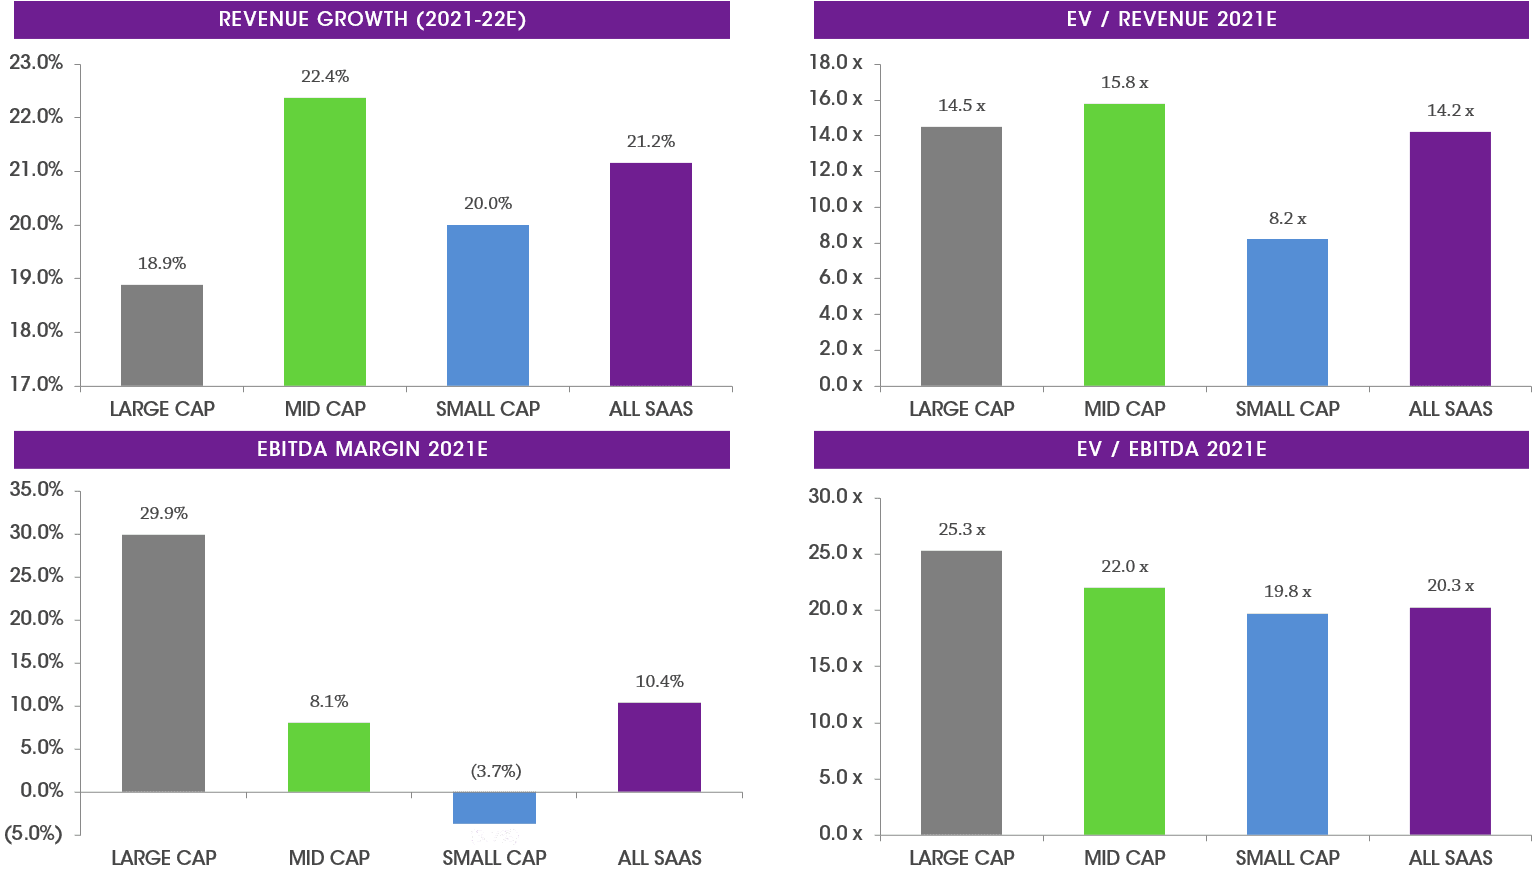
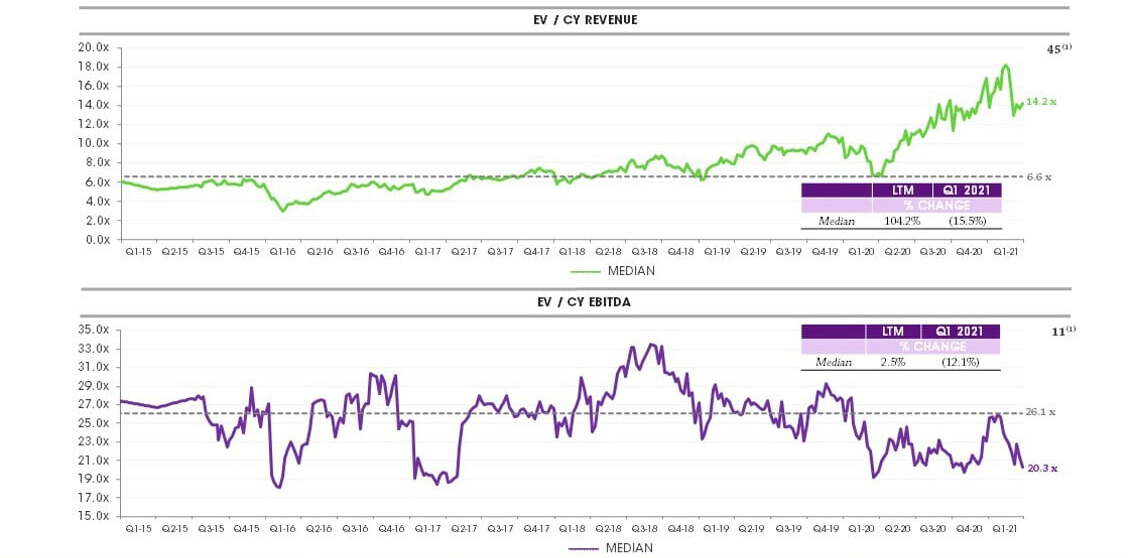
The median EV/Revenue 2021E multiple for our index is at 14.2x, down slightly from an all-time high of 16.8x at the end of 2020. The 6-year median EV/Revenue multiple is 6.6x, however the index has been steadily pulling away from this median since early 2019
The median EV/EBITDA 2021E multiple for our index is 20.3x
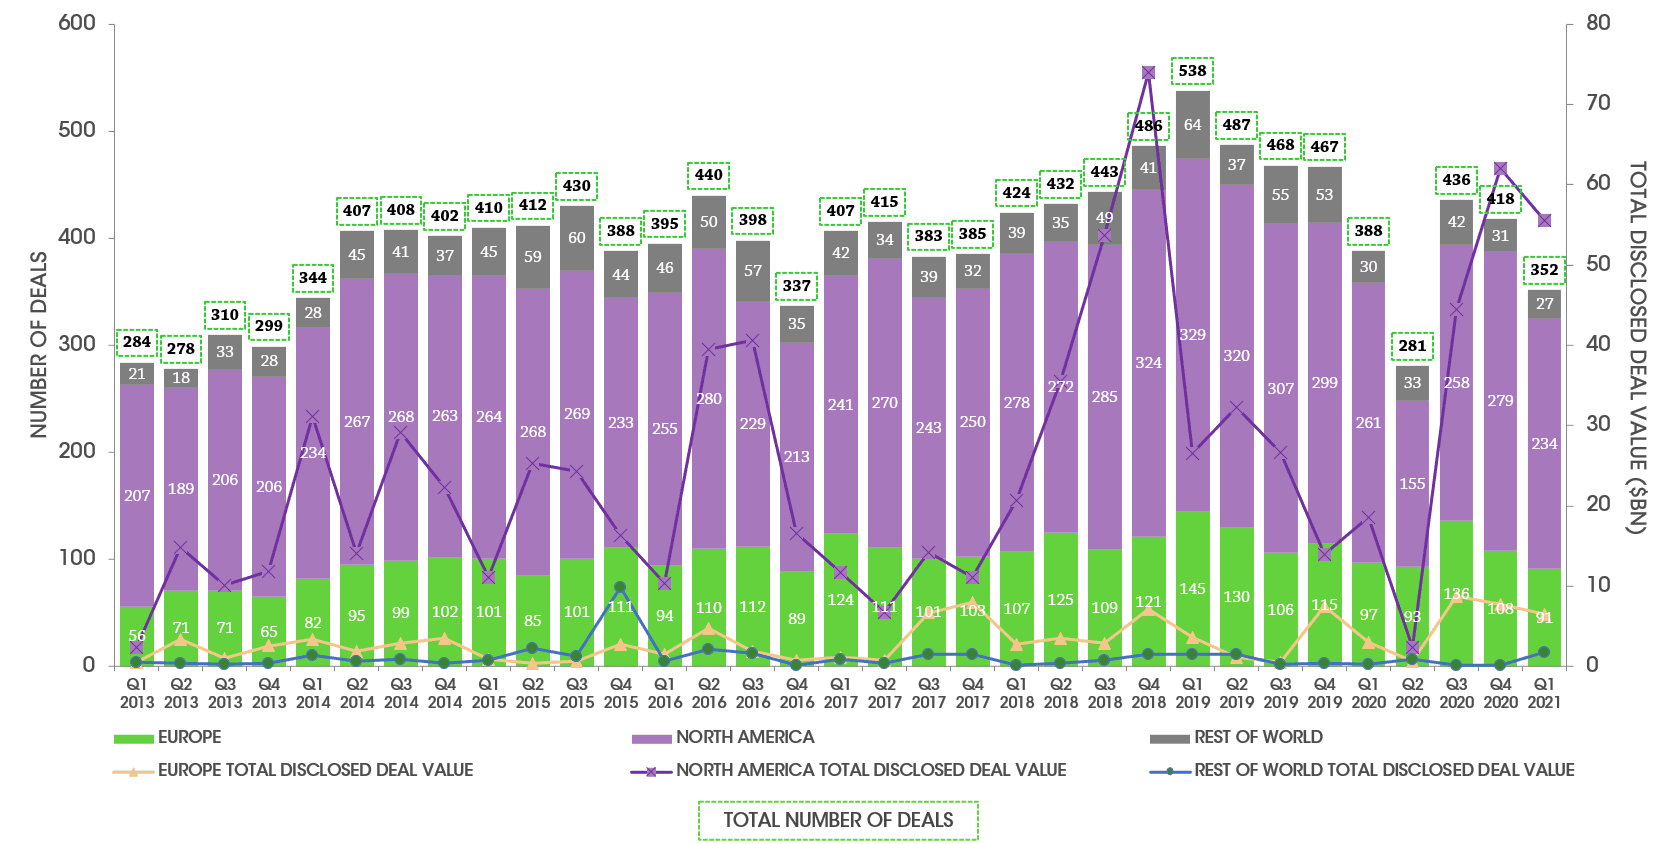
Deal activity and valuations remain strong, although deal volumes were down slightly on the second half of last year (352 vs 400+ in each of Q3 and Q4 2020)
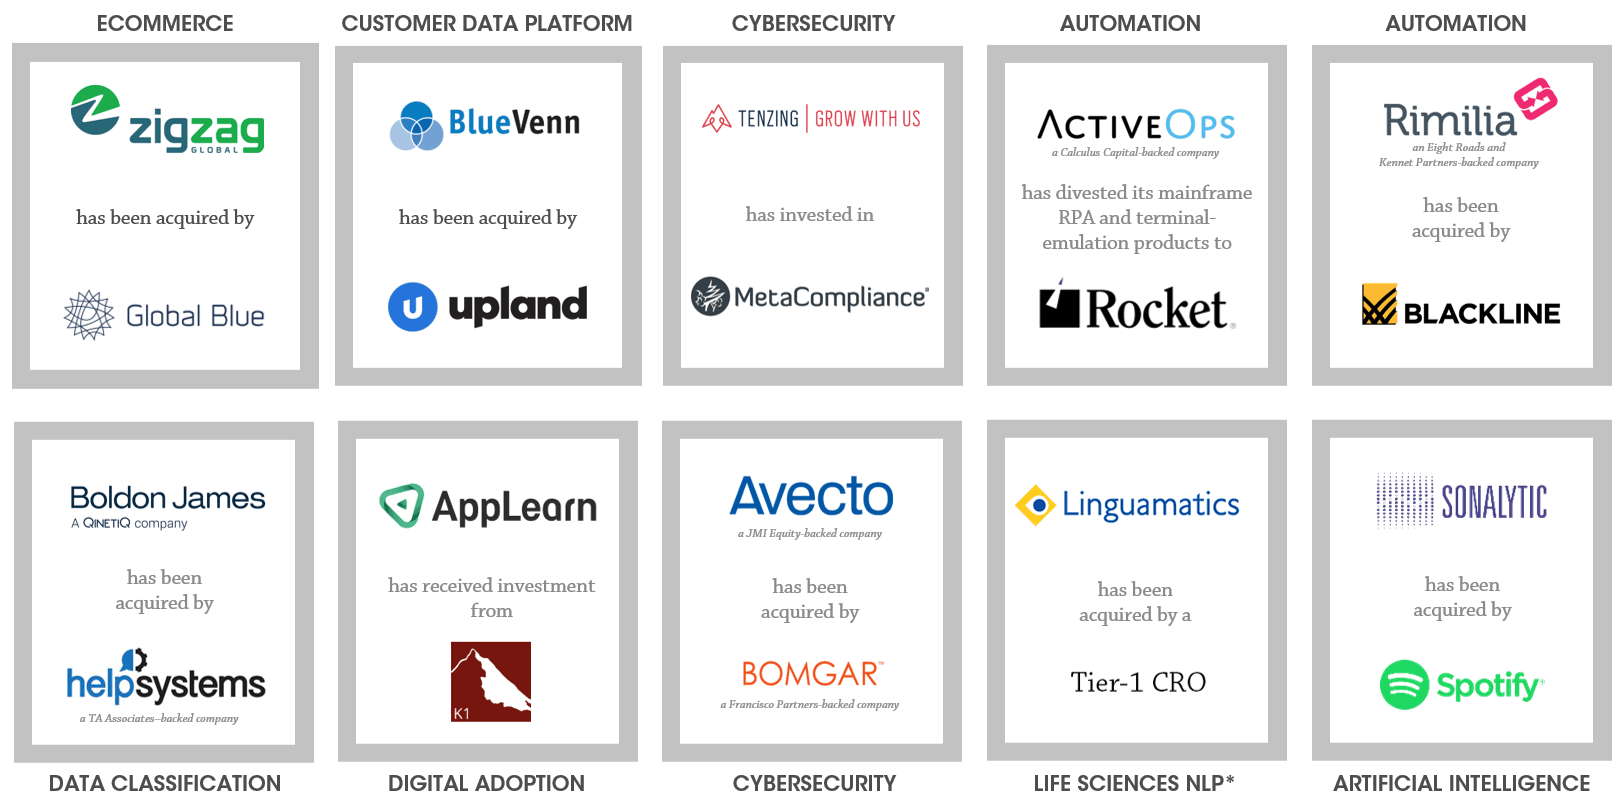
*Natural Language Processing
Notes: Based on share prices as at 31st March 2021; indices weighted by market capitalisation. Sources: Capital IQ and Results International analysis.
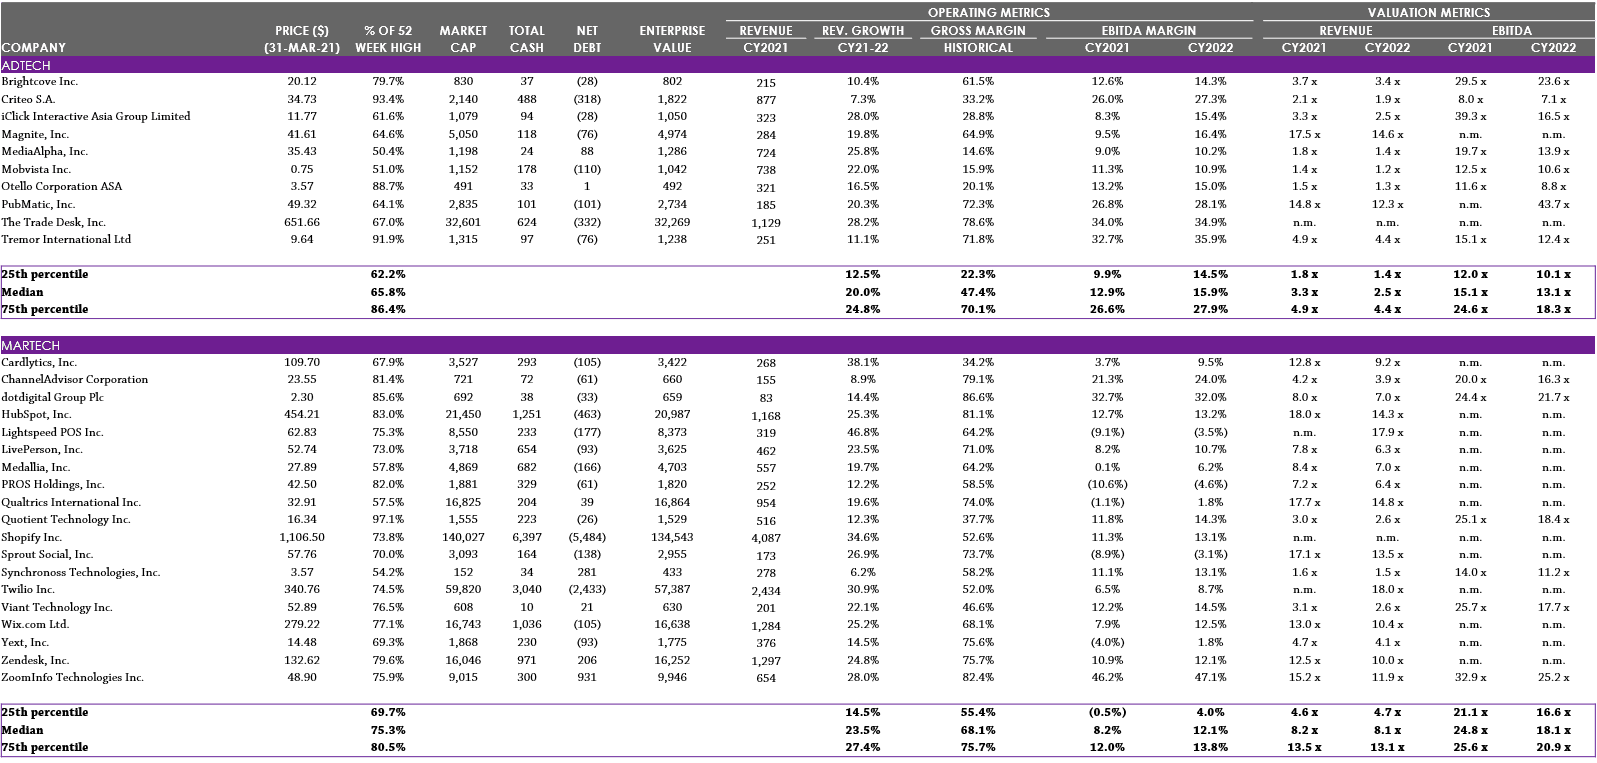
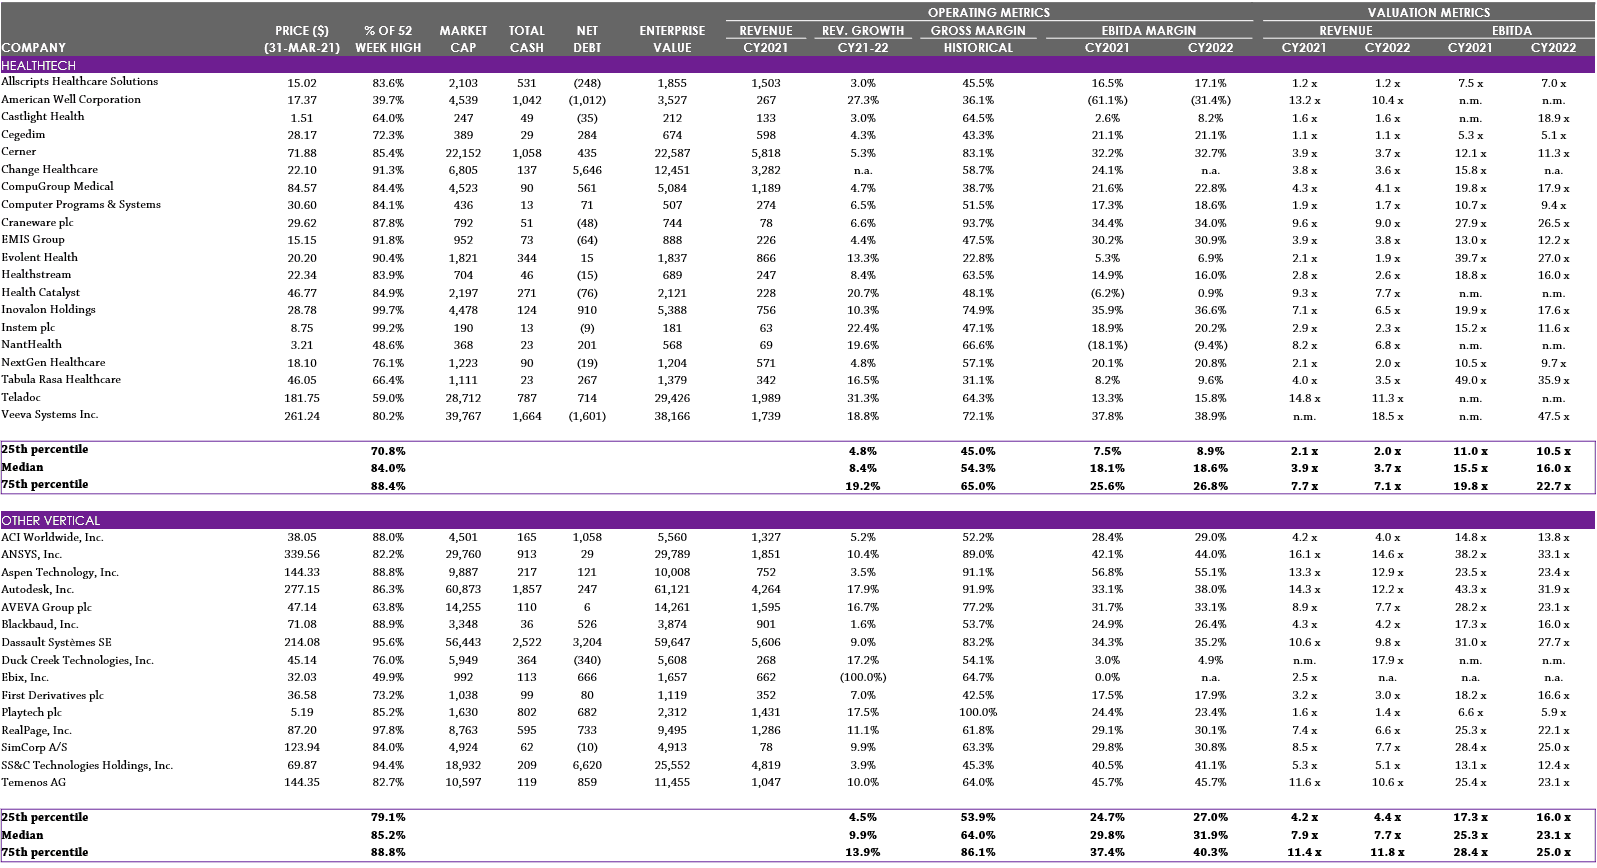
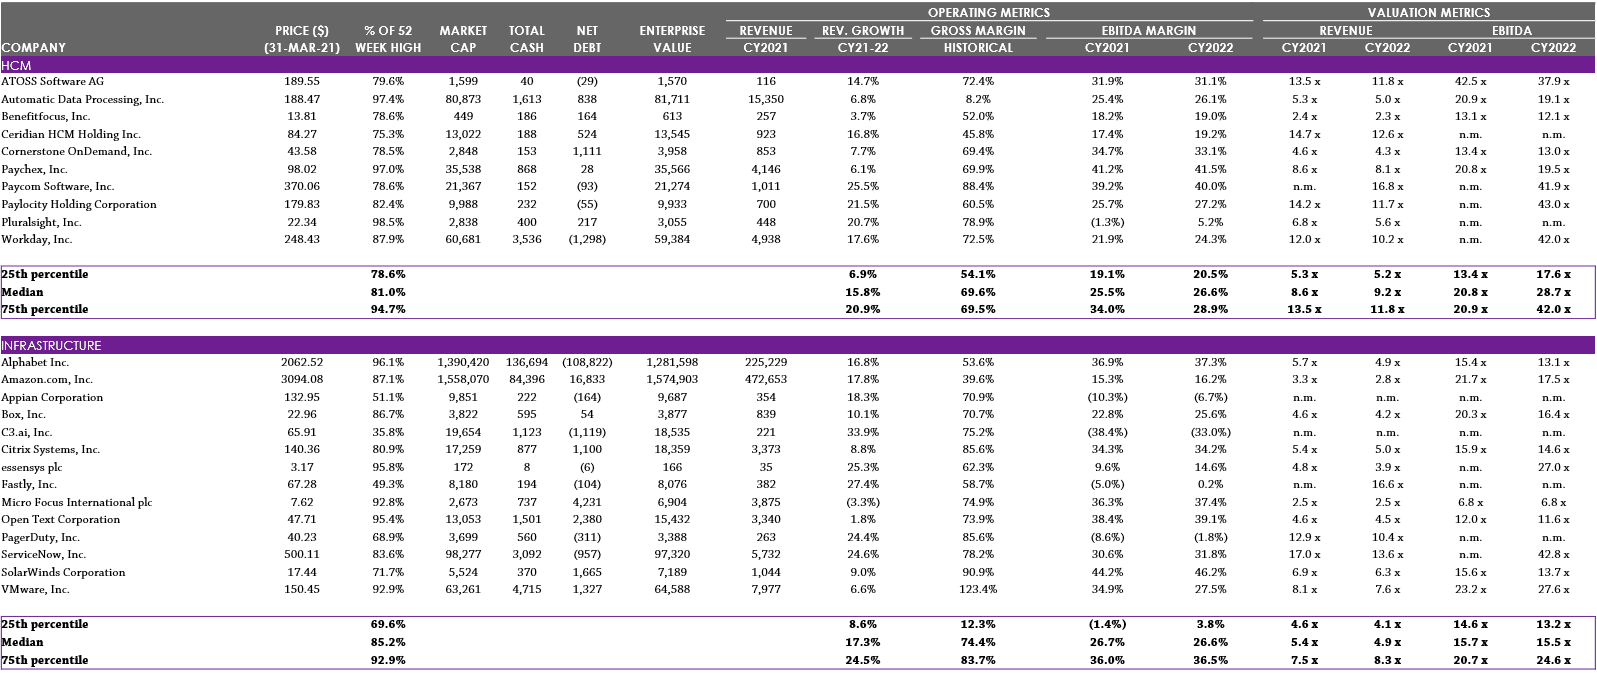
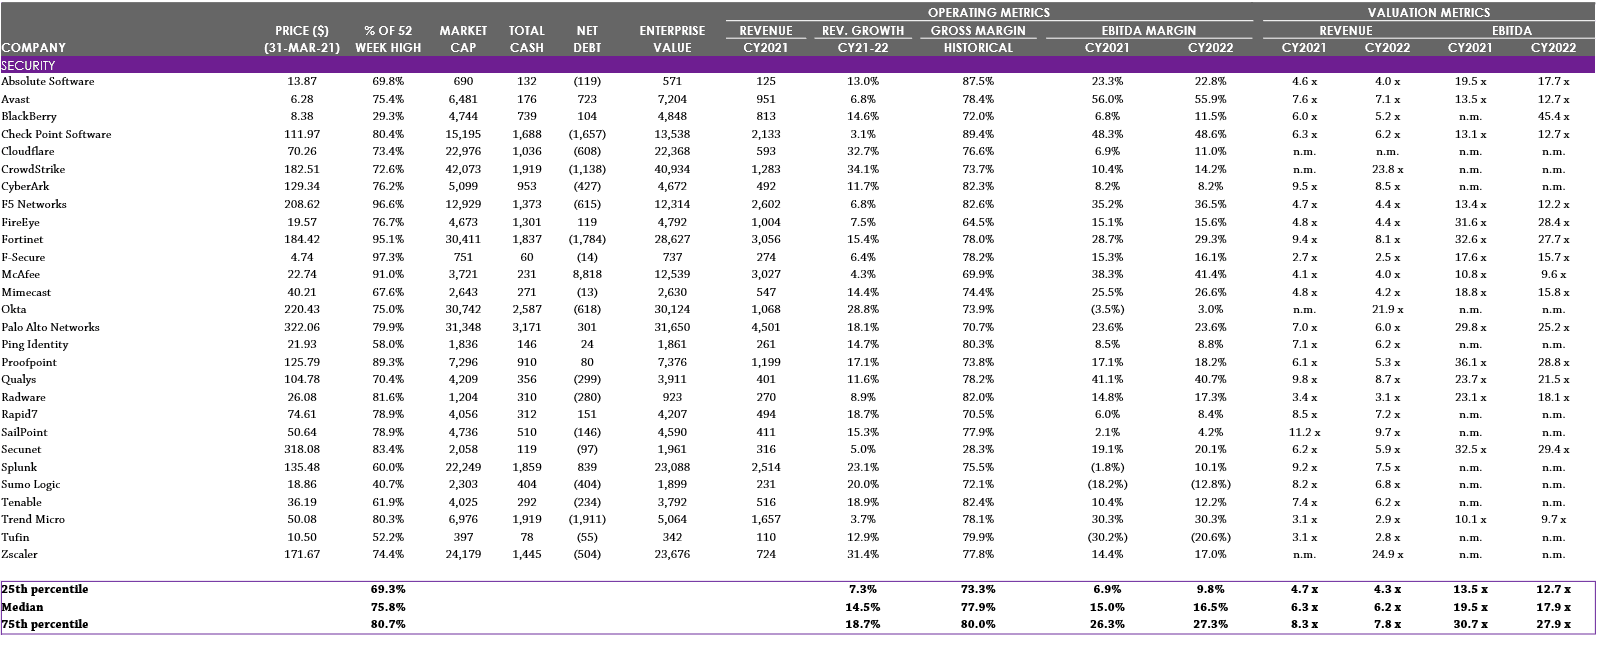
Note: For Security, 75th percentile values have been overlaid (shaded lighter) to illustrate next-generation vendors. Note: EV = Enterprise Value; financials calendarised to December year end; median values reported. See Selected Publicly Traded Companies (click here) for details of companies included in each category. Source: Capital IQ
Sources: Press releases, Capital IQ, Mergermarket, 451 Research and Results International analysis.
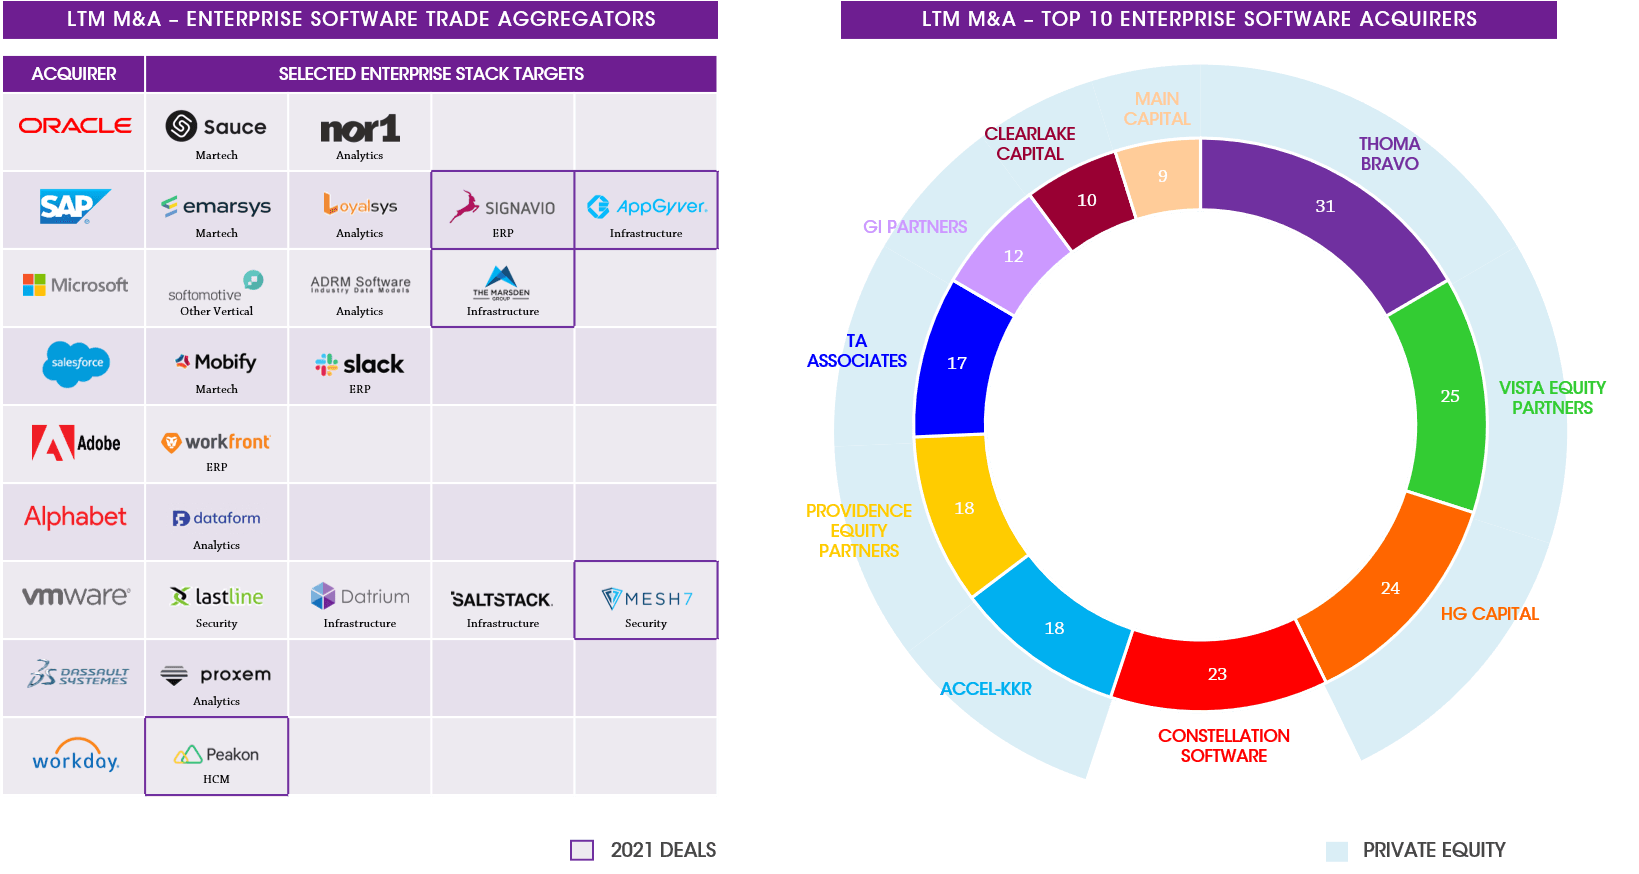
Note: PE also shown as acquirer when acquisitions made through portfolio company; parent also shown as acquirer when acquisition made through group subsidiary/ group. Sources: Press releases, Capital IQ, Mergermarket, 451 Research and Results International analysis.
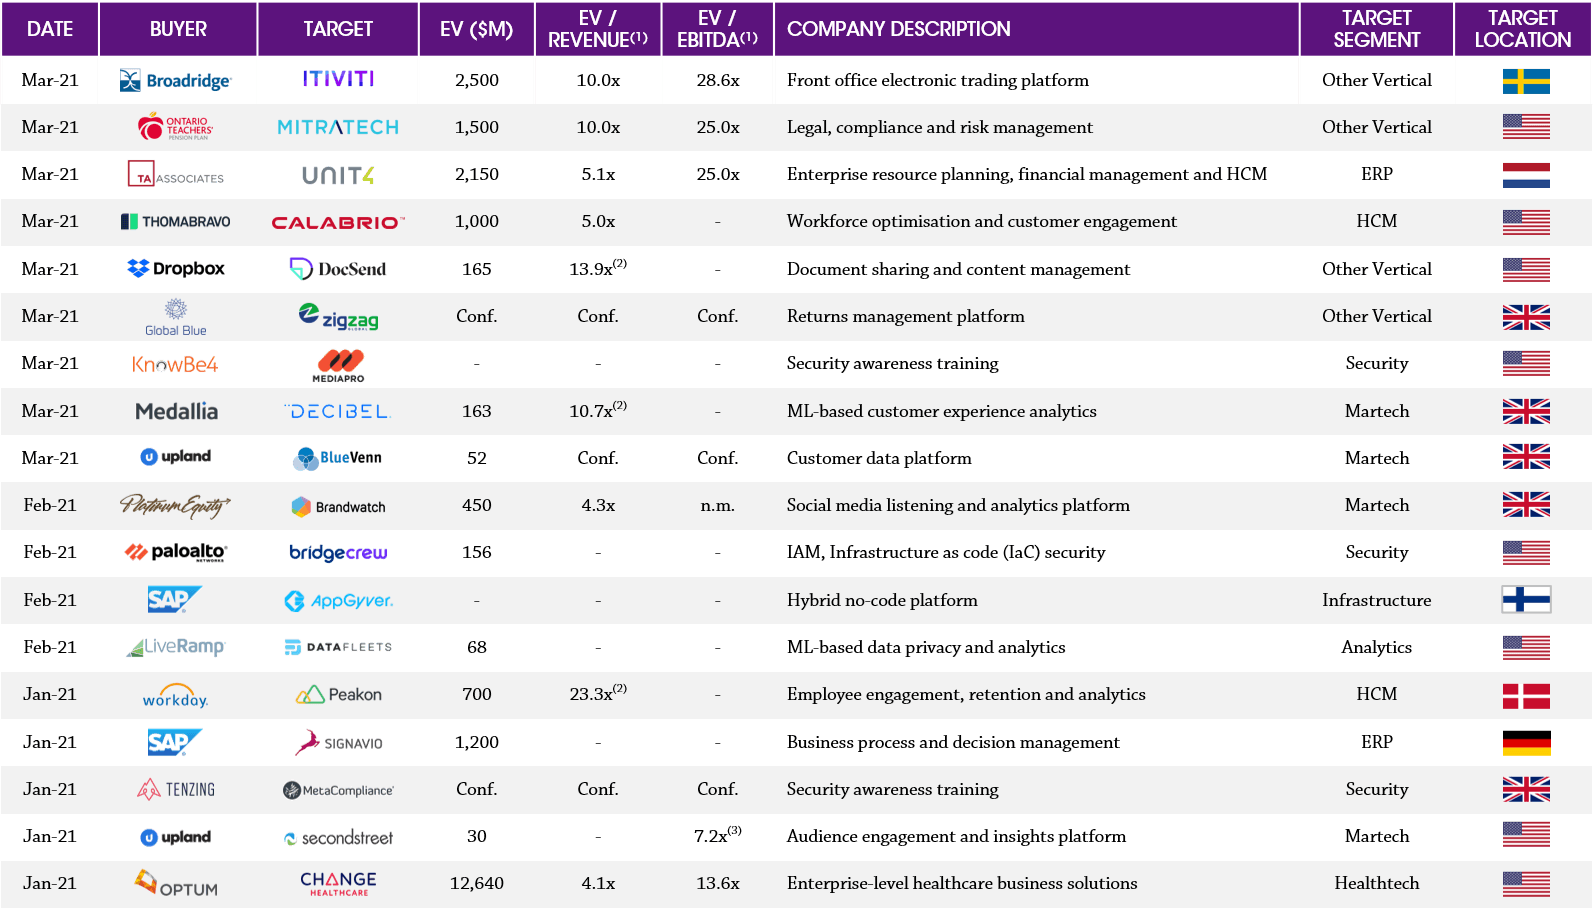
1) In certain cases EV/Revenue and EV/EBITDA are publicly reported estimates; TTM financials have been used where possible; EV = transaction value scaled to 100% shareholding plus net debt (incl. minority interest) (2) Based on 451 estimates (3) Based on FY21 projected financials. Note: Earnout considerations excluded in the calculation of Enterprise Value. Sources: Press releases, 451 Research and Results International analysis.
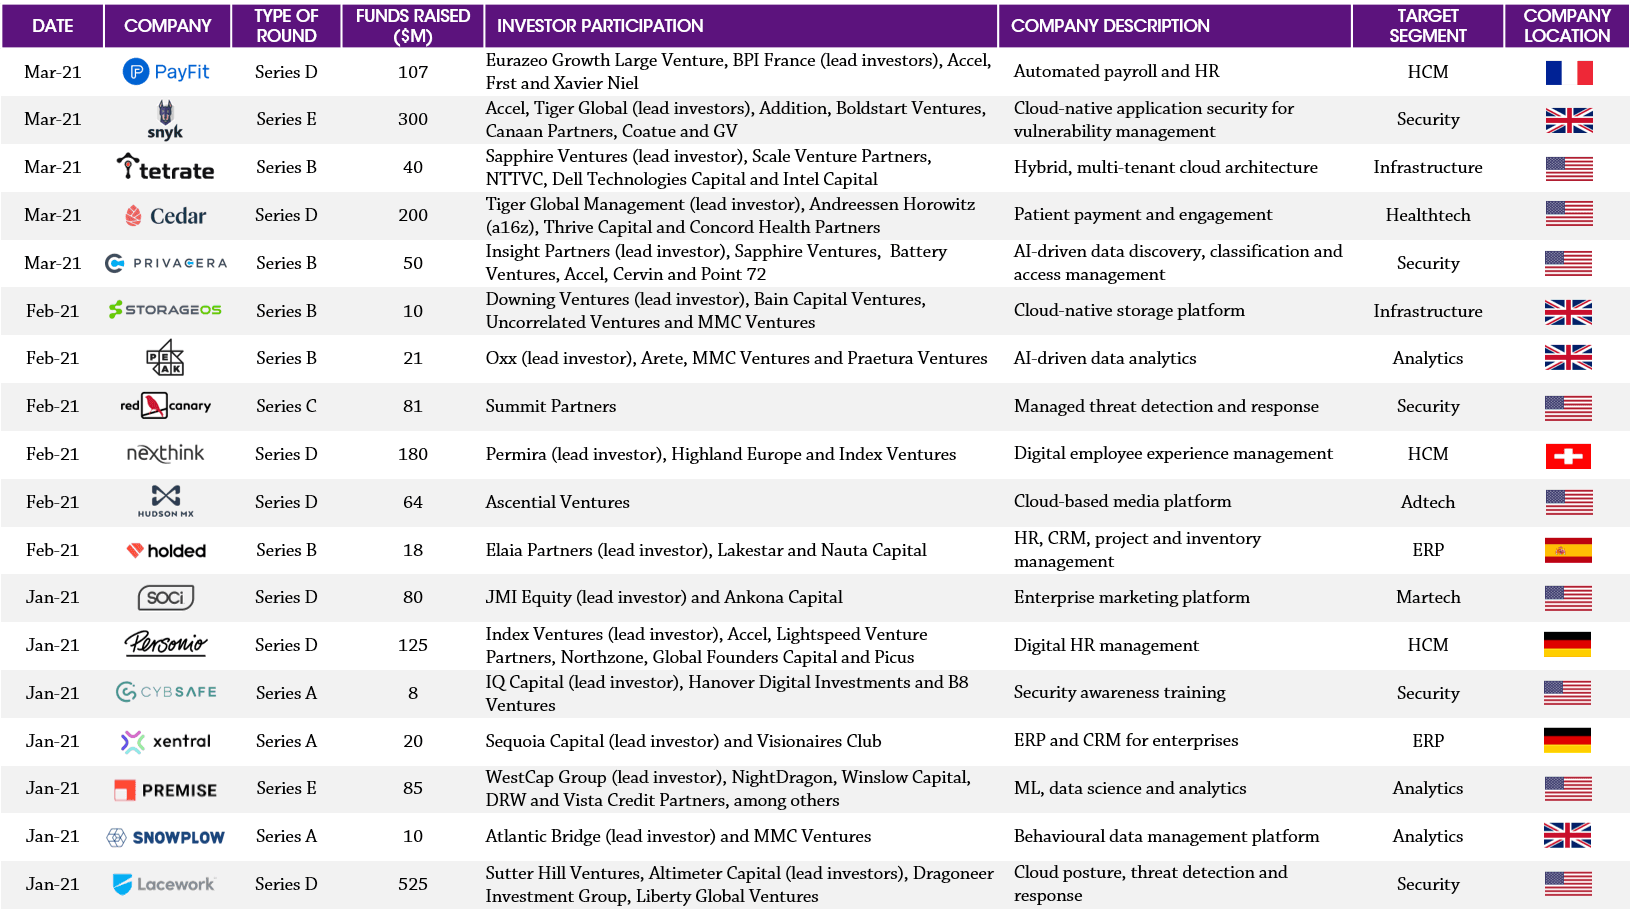
Sources: Pitchbook, Press releases, Crunchbase and Results International analysis
(1) These companies IPO’d within the last 12 months/last quarter, the share price movement represents the change between the stock’s IPO date and 31st March 2021. Note: Based on share prices as at 31st March 2021. Sources: Capital IQ and Results International analysis.
(1) These companies IPO’d within the last 12 months, the share price movement represents the change between the stock’s IPO date and 31st March 2021. Note: Based on share prices as at 31st March 2021. Sources: Capital IQ and Results International analysis.
(1) All SaaS represents the median of all stocks in Large Cap, Mid Cap and Small Cap, with no weighting applied. Notes: EV = Enterprise Value; financials calendarised to December year end; median values reported. See Selected Publicly Traded Companies (click here) for details of companies included in each category. Sources: Capital IQ and analyst reports
(1)Number of companies with applicable multiples in Q1 2021 index. Notes: EV = Enterprise Value; financials calendarised to December year end, which can impact the multiples at the start of each year as the base is shifted forward; weekly tracking of valuation multiples commenced in July 2015, October 2014 – June 2015 tracked on a quarterly basis, therefore a linear progression has been assumed between quarters up to July 2015. Dotted line represents median since data has been tracked. Source: Capital IQ.
Note: Calendarised to December year end; $ millions, except share price data; multiples capped at 20x EV / Revenue and 50x EV / EBITDA; net debt includes minority interest. Source: Capital IQ.
Note: Calendarised to December year end; $ millions, except share price data; multiples capped at 20x EV / Revenue and 50x EV / EBITDA; net debt includes minority interest. Source: Capital IQ
Note: Calendarised to December year end; $ millions, except share price data; multiples capped at 25x EV / Revenue and 50x EV / EBITDA; net debt includes minority interest. Source: Capital IQ.
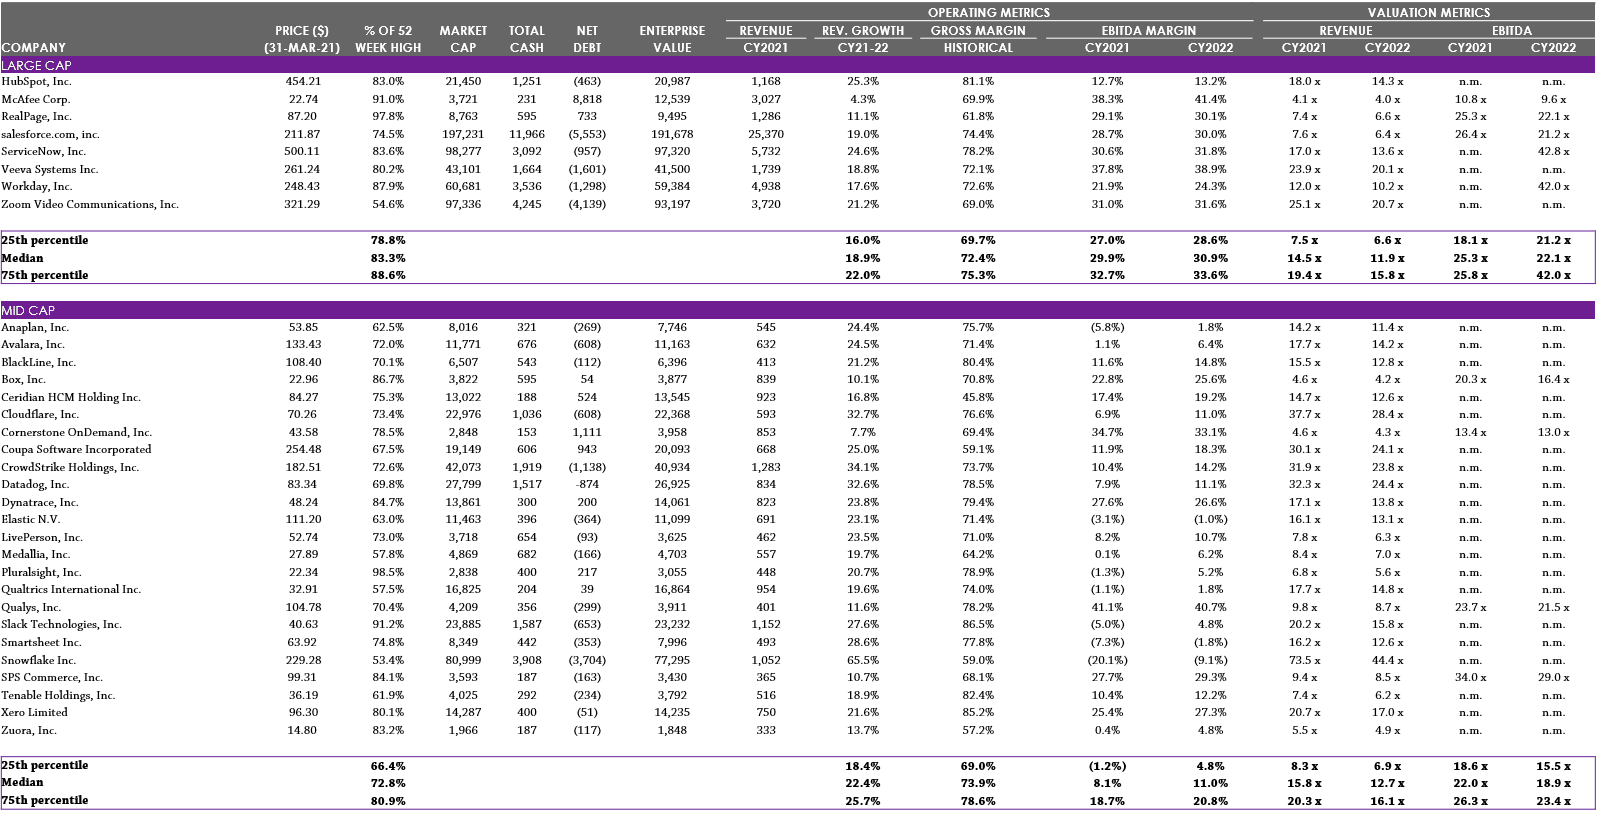
Note: Calendarised to December year end; $ millions, except share price data; multiples capped at 100x EV / Revenue and 50x EV / EBITDA; net debt includes minority interest. Note: Market cap classifications categorised by CY2021E revenue: Large Cap: revenues greater than $900m; Mid Cap: revenues between $300m and $900m; Small Cap: revenues less than $300m. Source: Capital IQ, broker reports
Note: Calendarised to December year end; $ millions, except share price data; multiples capped at 100x EV / Revenue and 50x EV / EBITDA; net debt includes minority interest. Note: Market cap classifications categorised by CY2021E revenue: Large Cap: revenues greater than $900m; Mid Cap: revenues between $300m and $900m; Small Cap: revenues less than $300m. Source: Capital IQ, broker reports.