Technology services sector market review: Q3 2020
Welcome to the Q3 2020 edition of our Technology Services Perspective – Results International’s quarterly market update of the technology services sector.
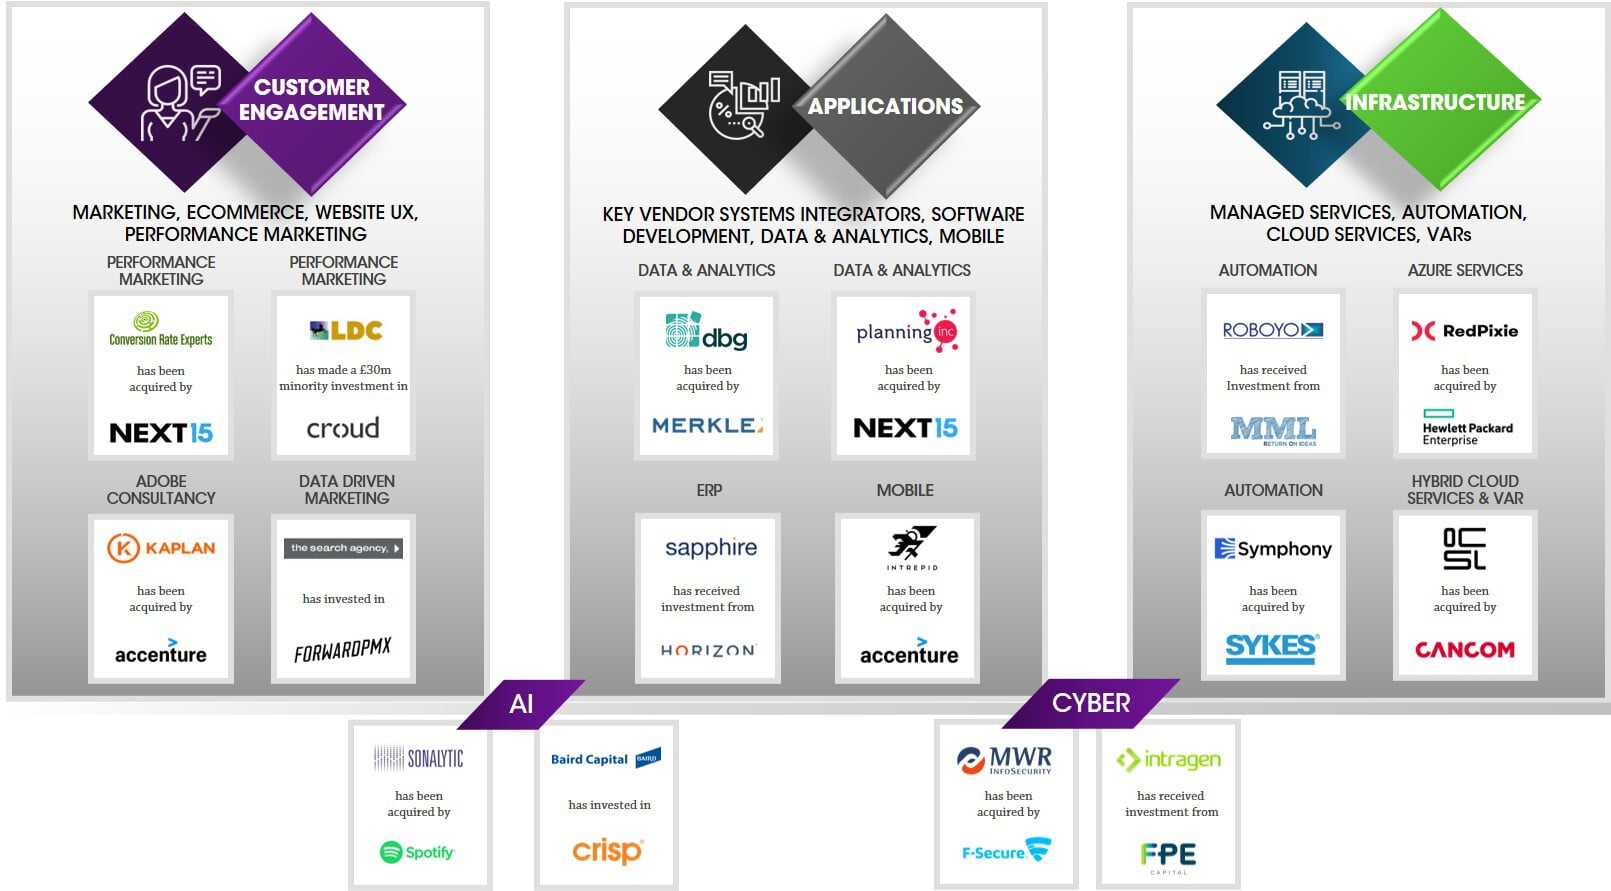
The subsectors we track include (i) customer engagement (marketing & eCommerce, website UX and performance marketing), (ii) applications (key vendor systems integrators, software development, data & analytics and mobile), (iii) infrastructure (managed services, automation, cloud services and VARs), (iv) AI and (v) cybersecurity services. Separately, we cover the broader marketing services market (beyond the customer engagement categories mentioned above) in our quarterly Marketing Services Market Review and security software in our quarterly CyberScope.
Despite the challenges of 2020, we continue to see many independent technology services companies trade very well through the year, particularly in areas such as digital transformation, automation, cloud consultancy and cybersecurity. Both strategic and PE interest in the sector remains strong, both in terms of deal volumes and valuations. If you are contemplating fundraising, exit, or growth through acquisition in the space – please do get in touch.
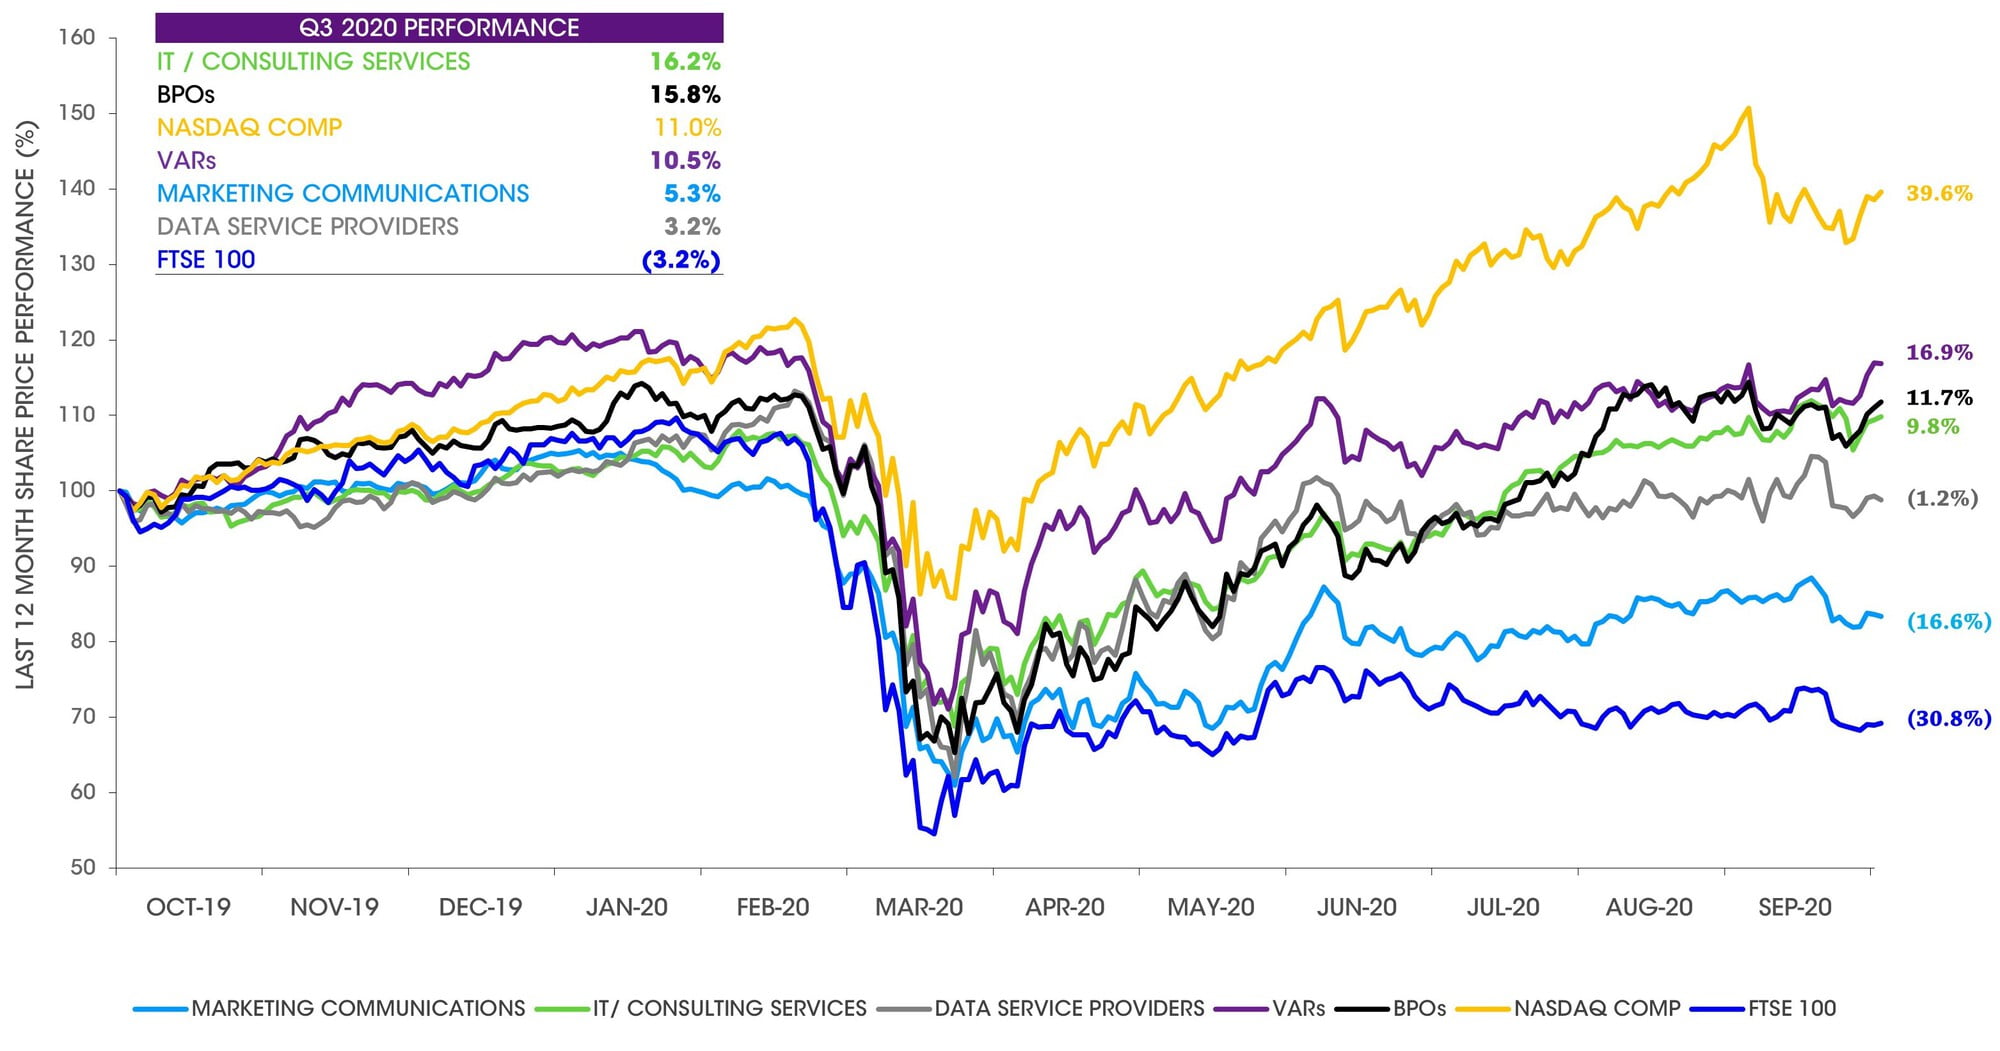
Notes: Based on share prices as at 30th September 2020; indices weighted by market capitalisation. Sources: Capital IQ and Results International analysis.
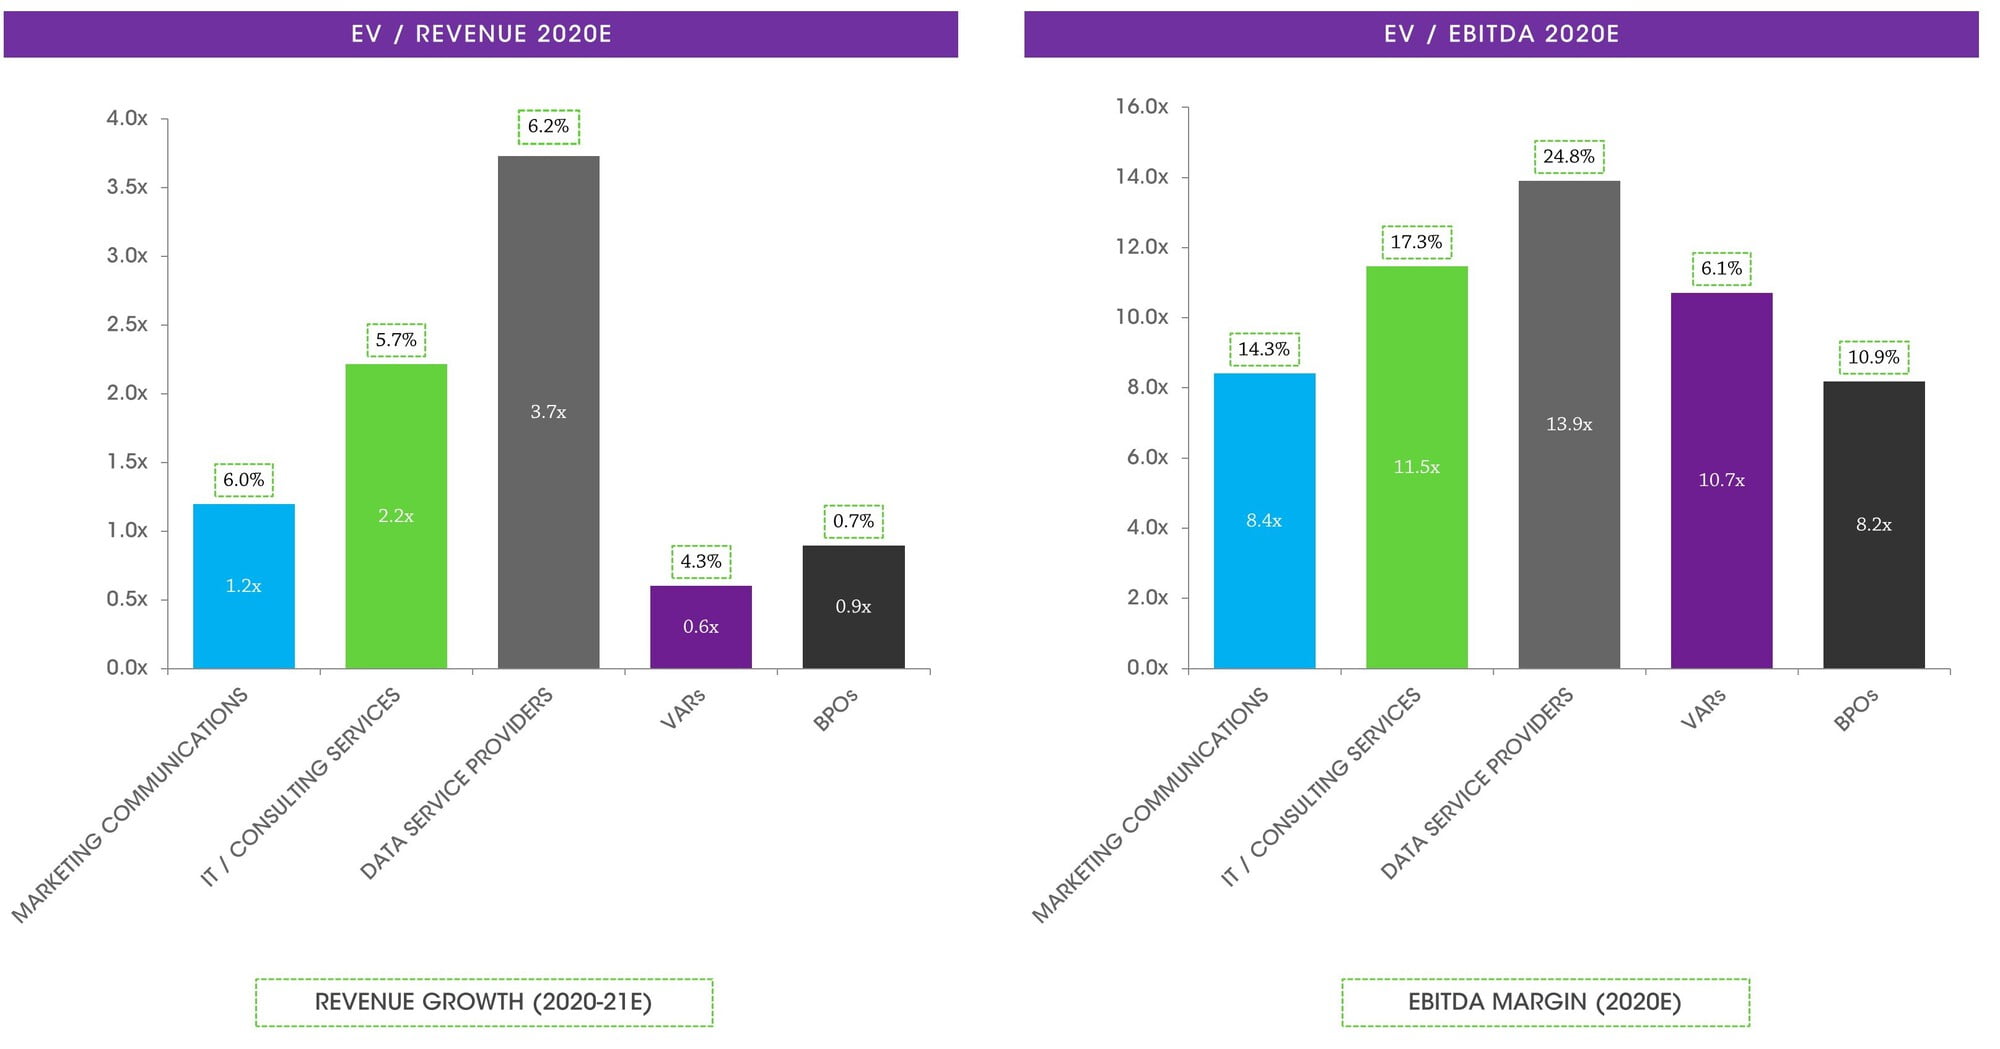
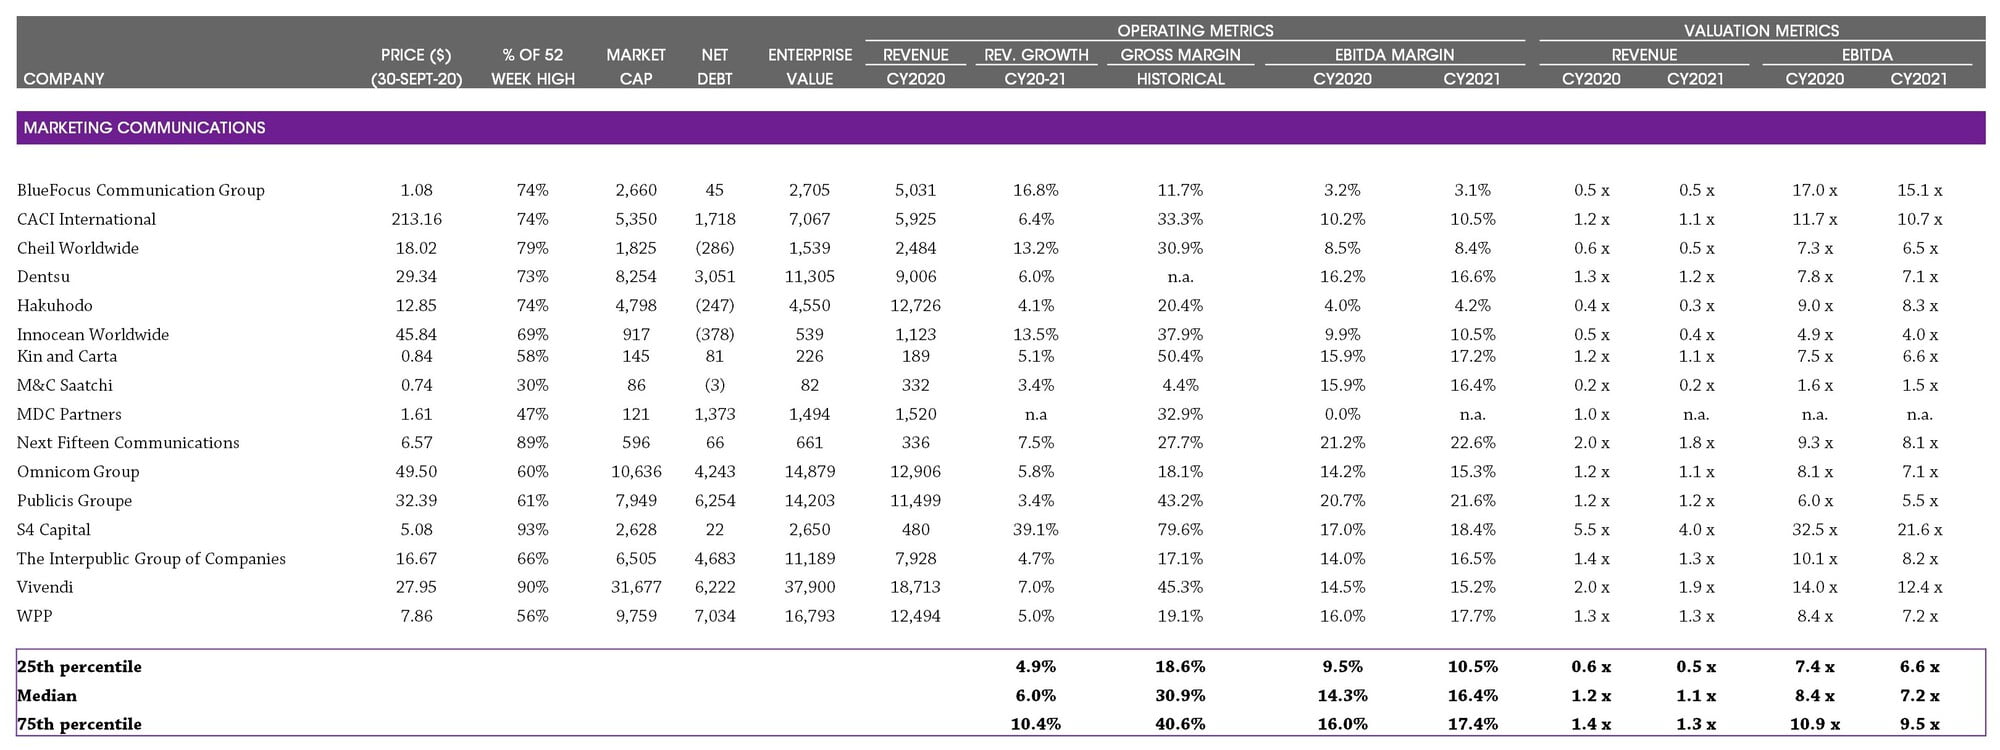
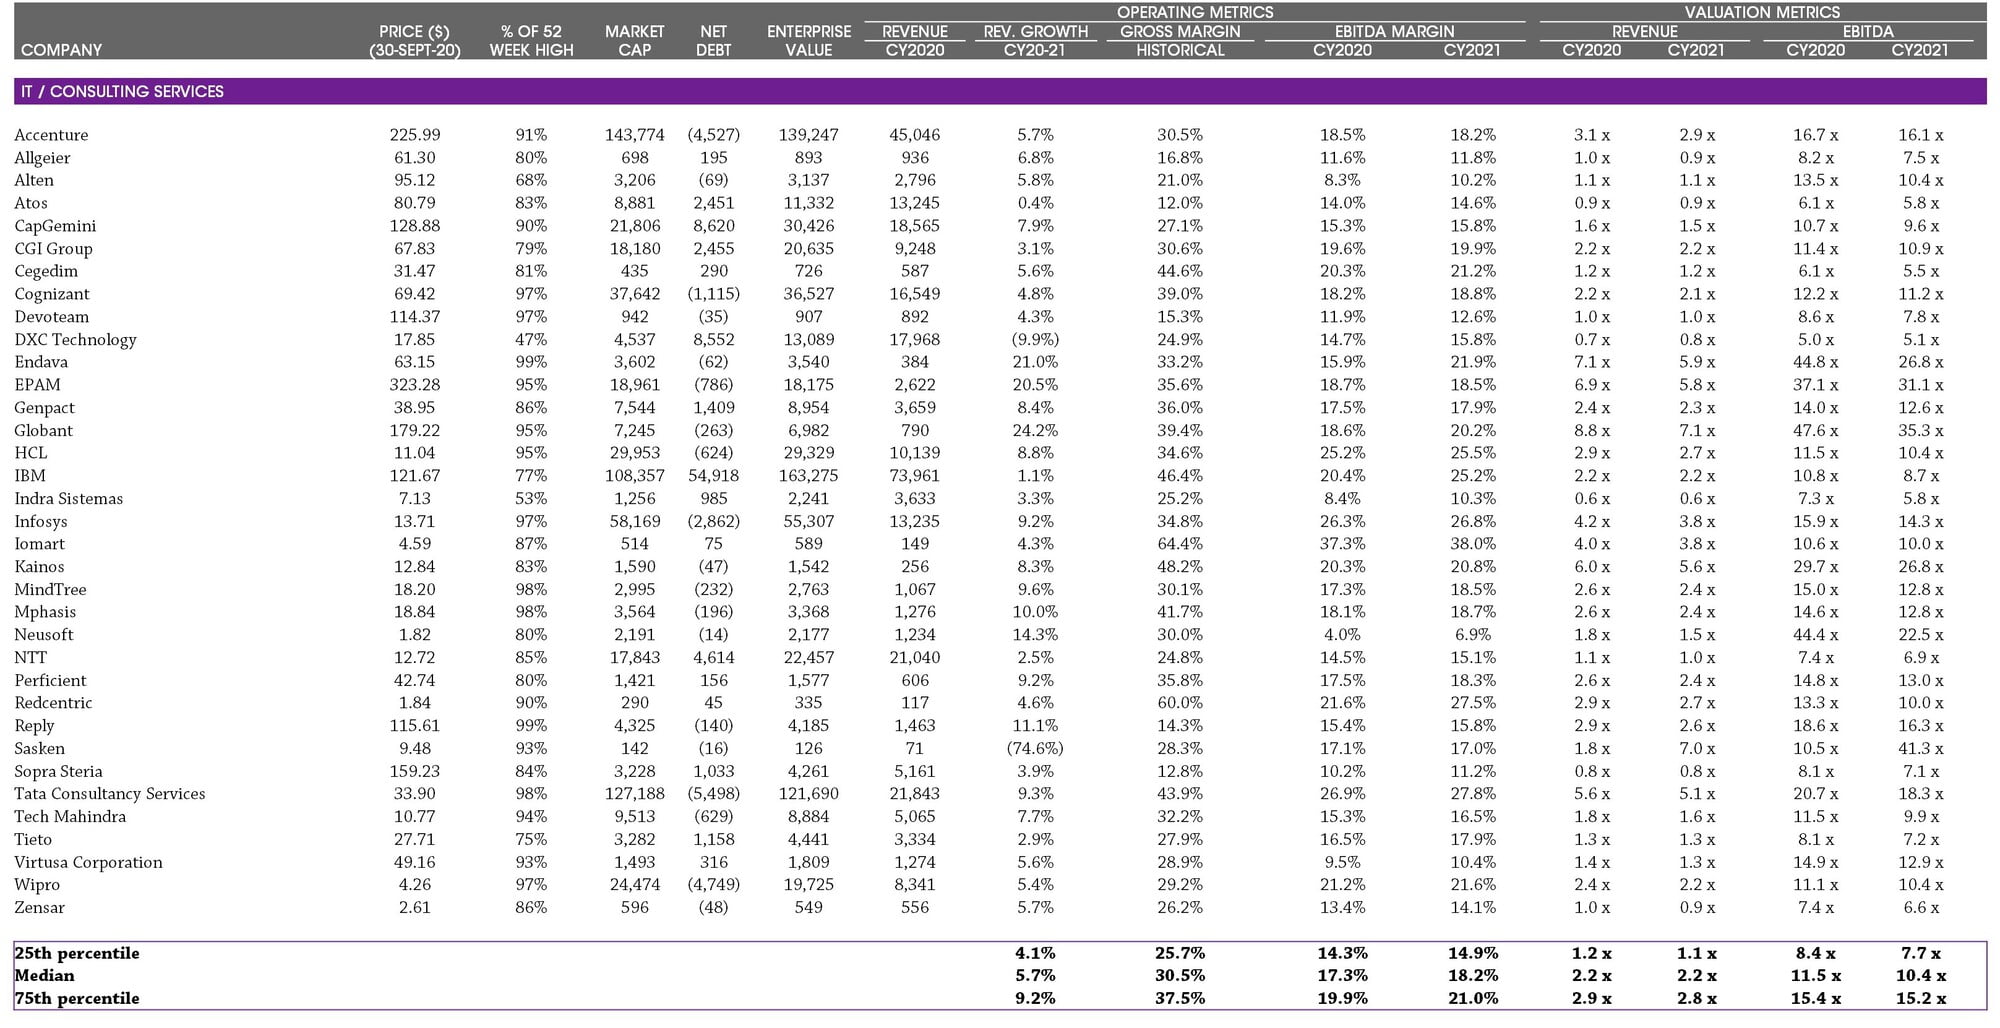
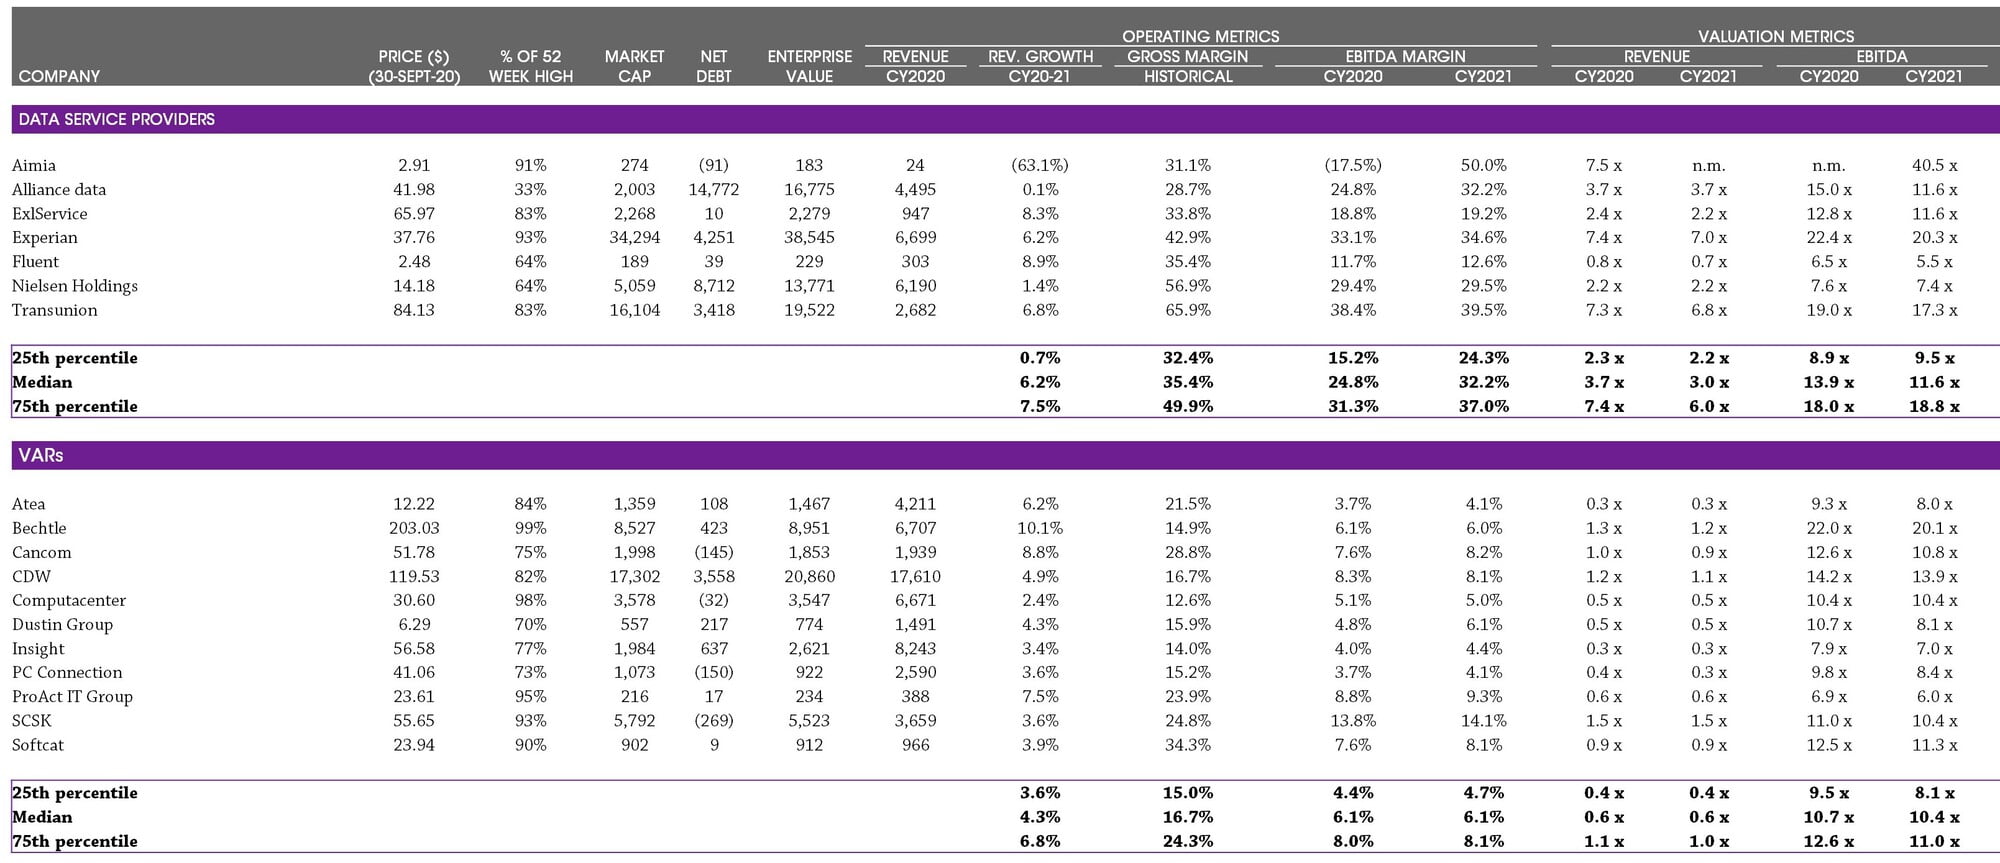
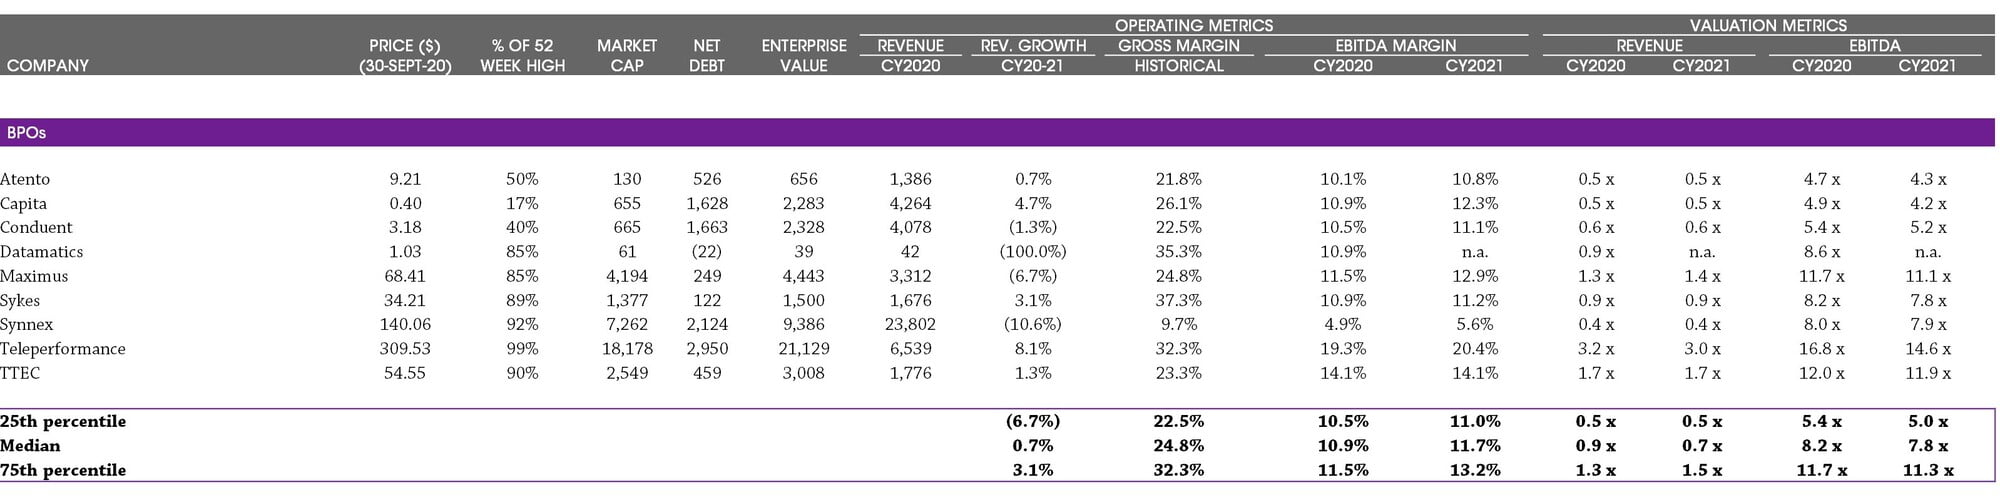
Note: EV = Enterprise Value; financials calendarised to December year end; median values reported. See the Selected Publicly Traded Companies section of this document for details of companies included in each category. Source: Capital IQ.
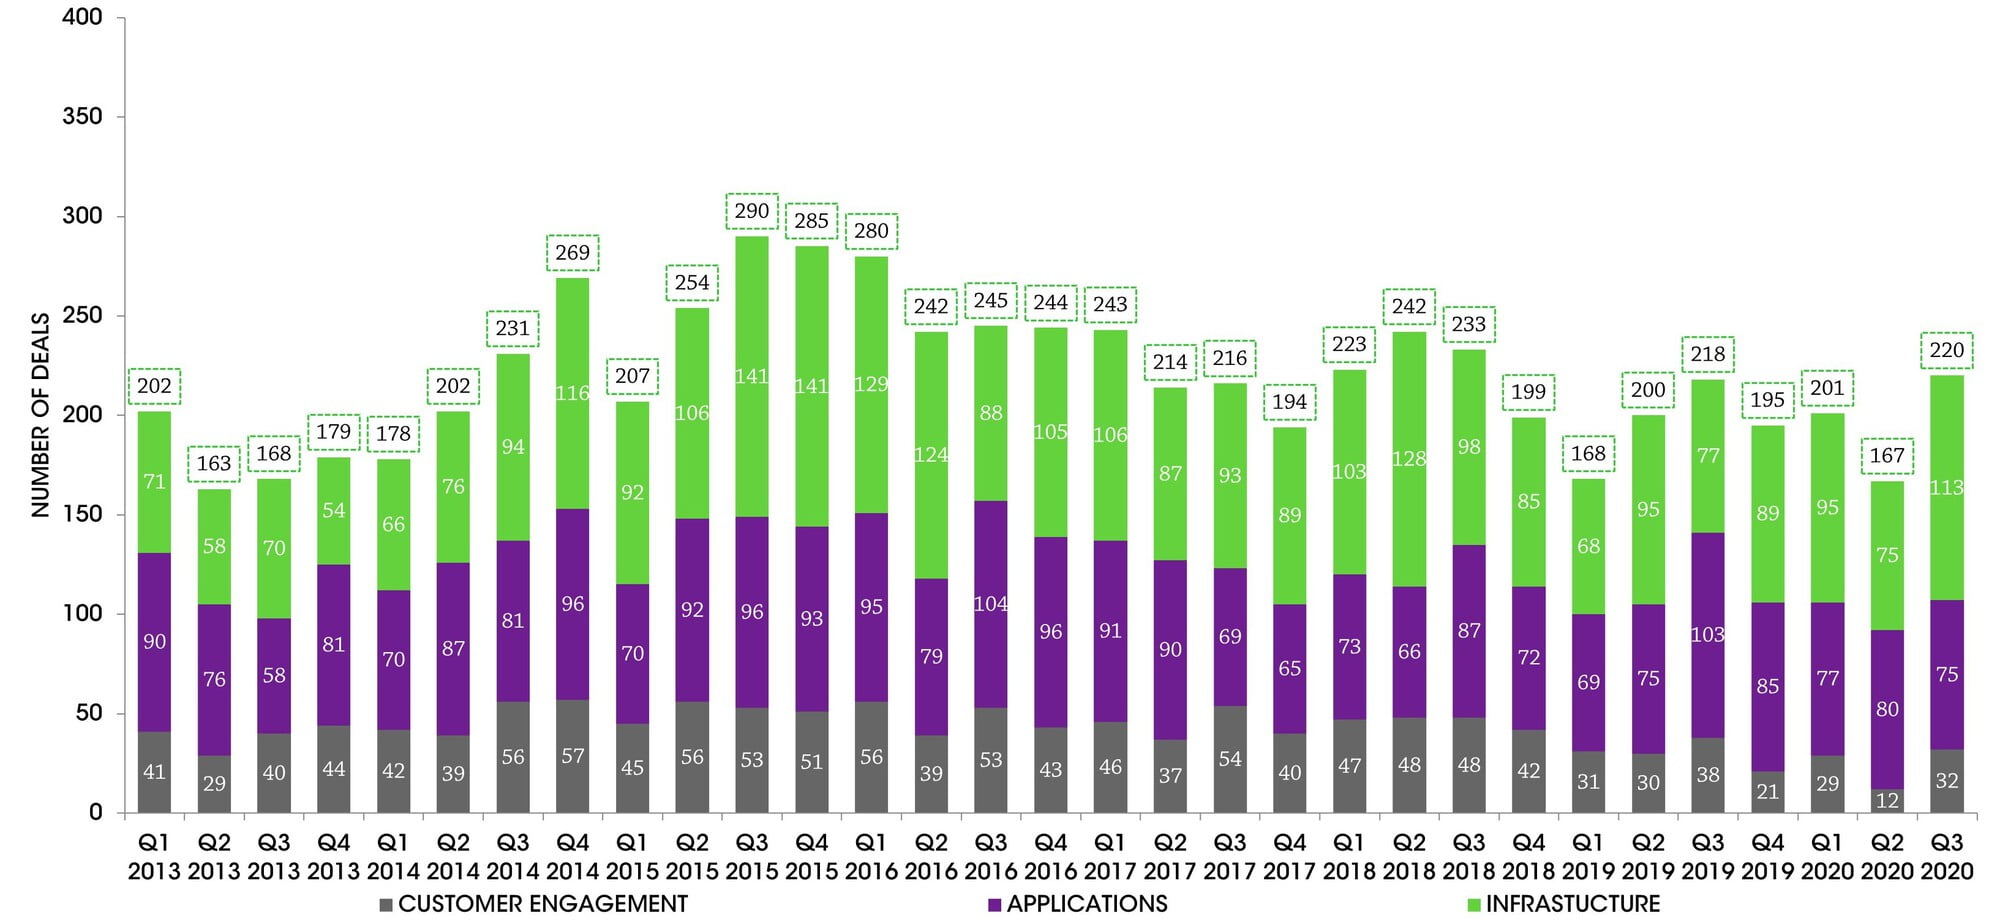
Sources: Press releases, Capital IQ, Mergermarket, 451 Research and Results International analysis.
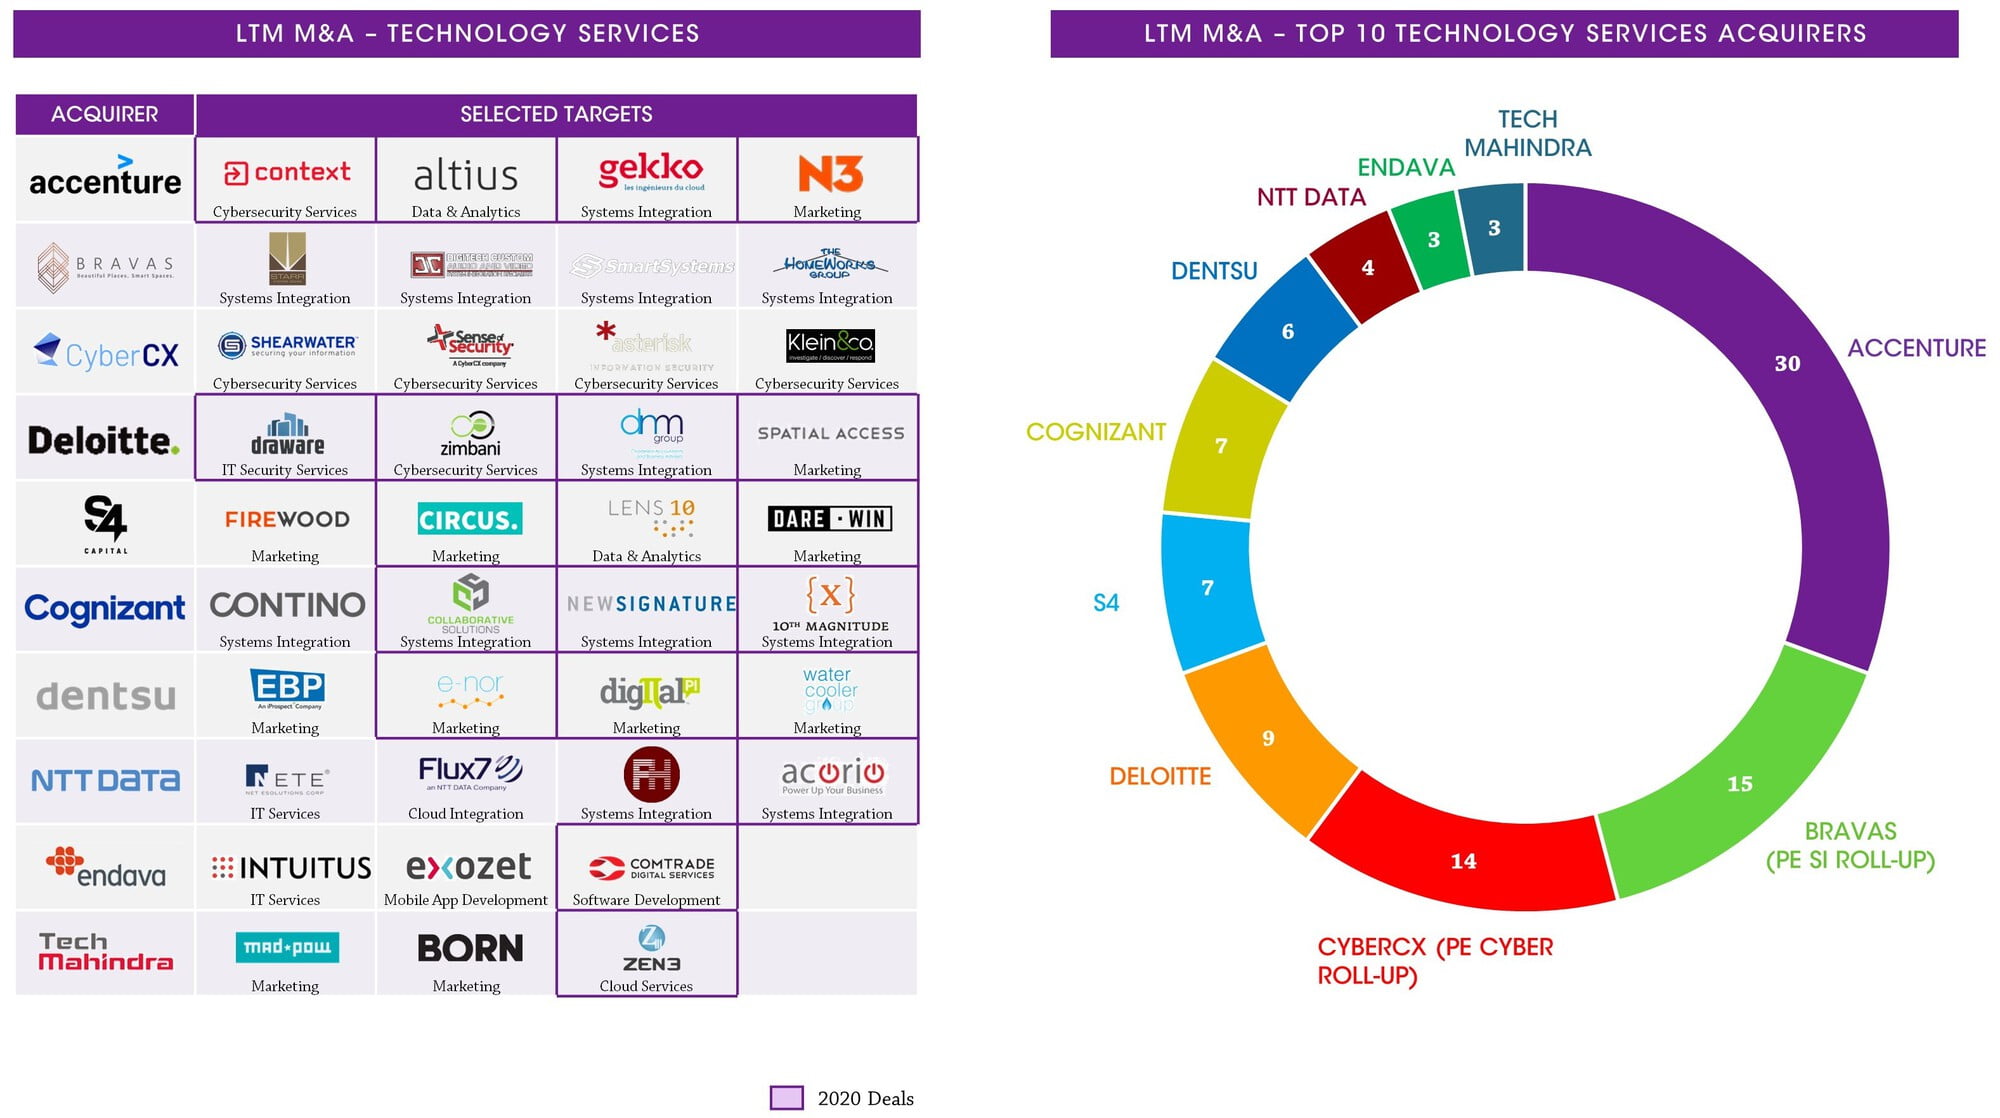
Note: Parent shown as acquirer when acquisition made through group subsidiary/ group. Sources: Press releases, Capital IQ, Mergermarket, 451 Research and Results International analysis.
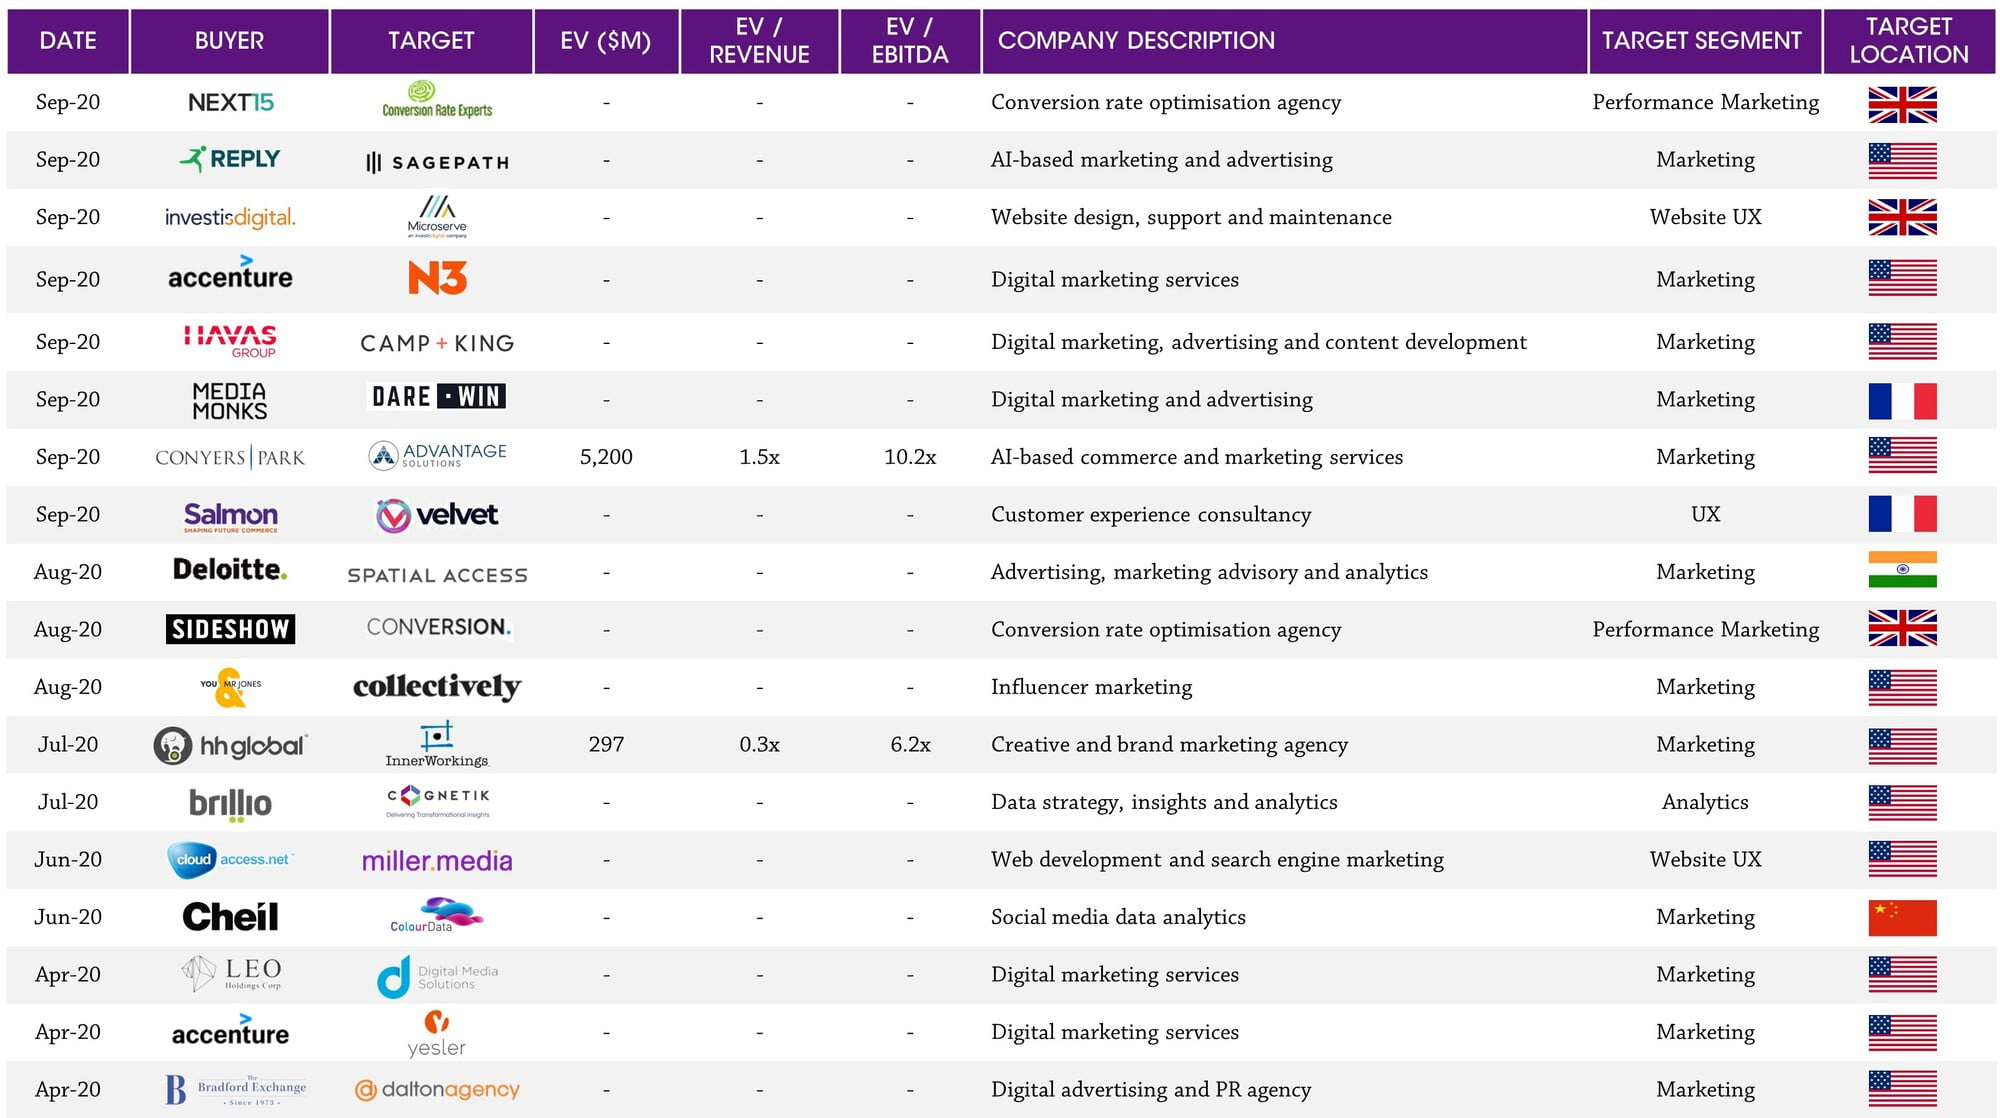
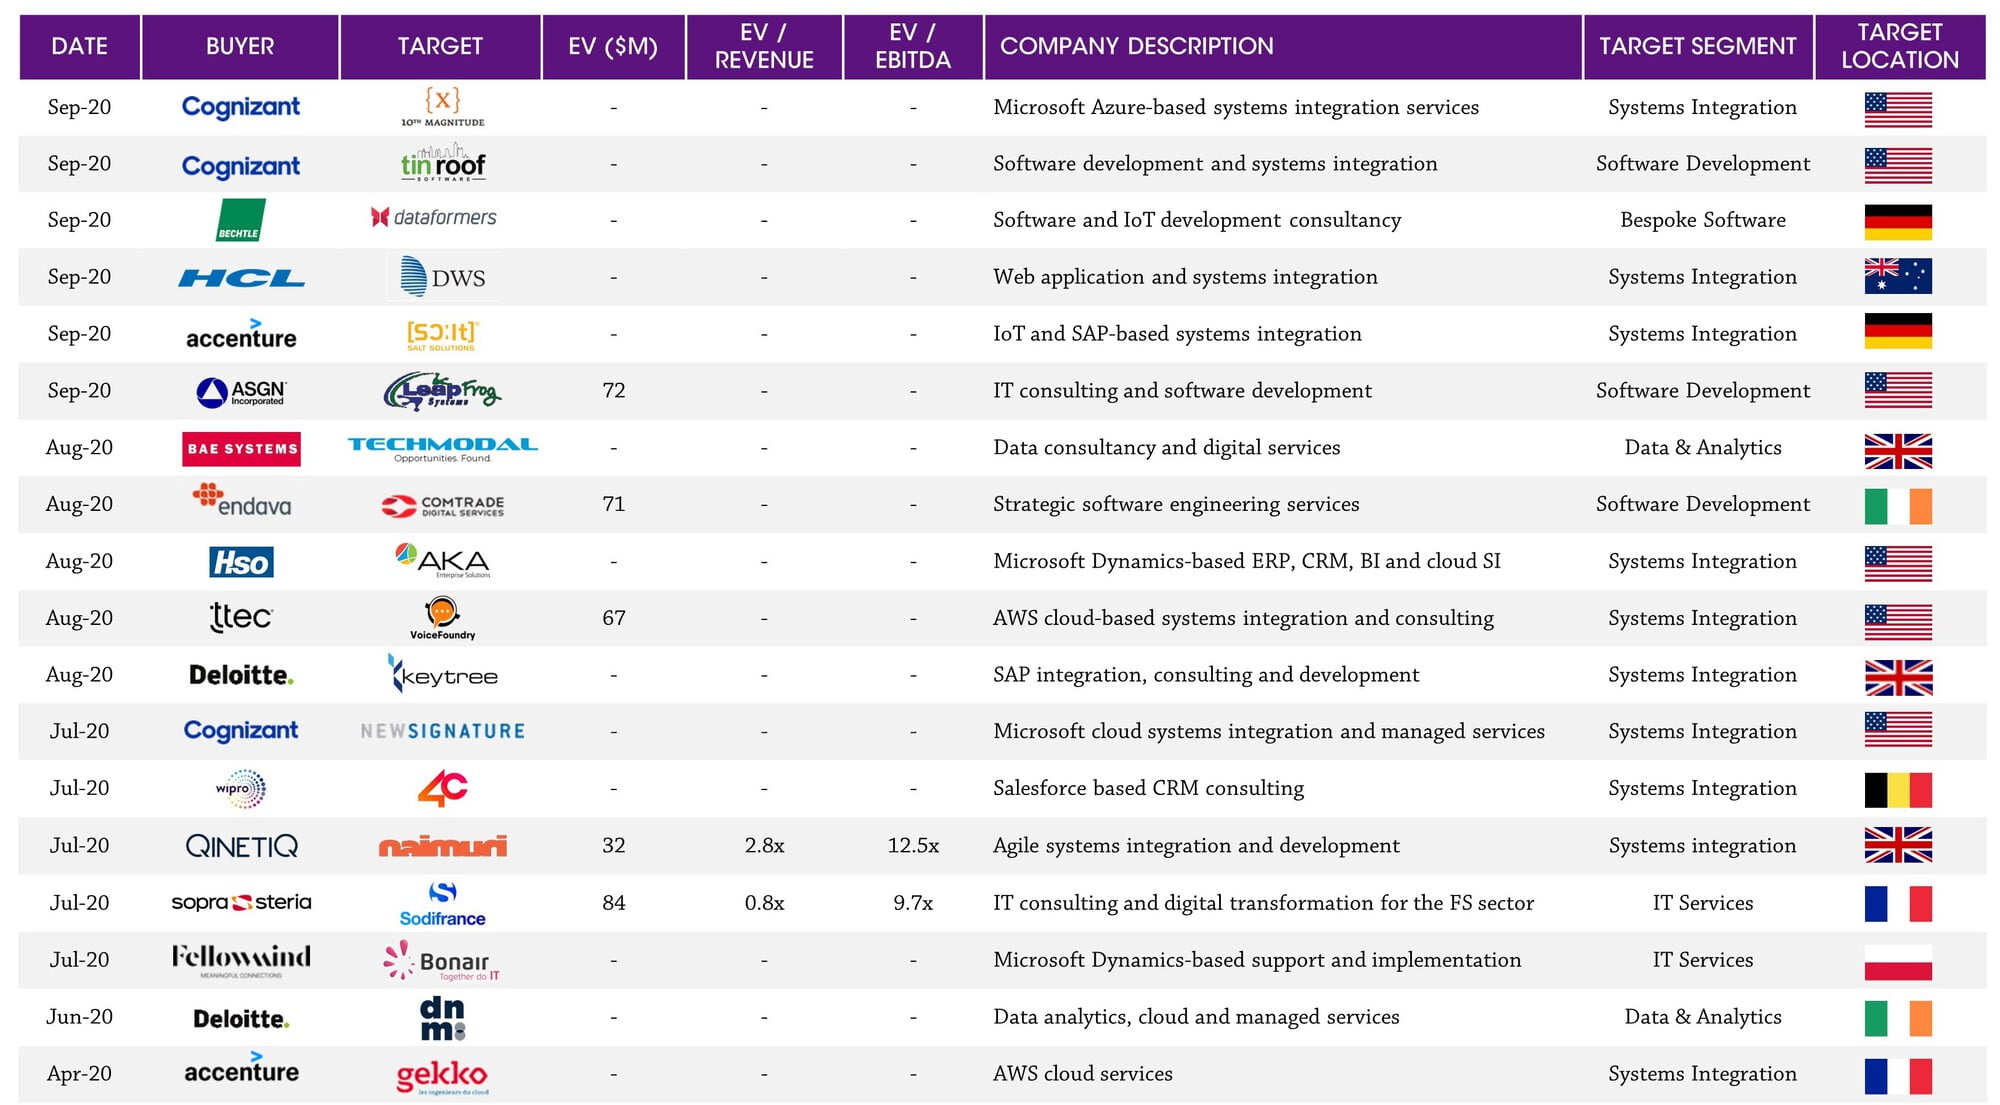
Note: In certain cases EV/Revenue and EV/EBITDA are publicly reported estimates; TTM financials have been used where possible; EV = transaction value scaled to 100% shareholding plus net debt (incl. minority interest). Sources: Press releases, 451 Research and Results International analysis.
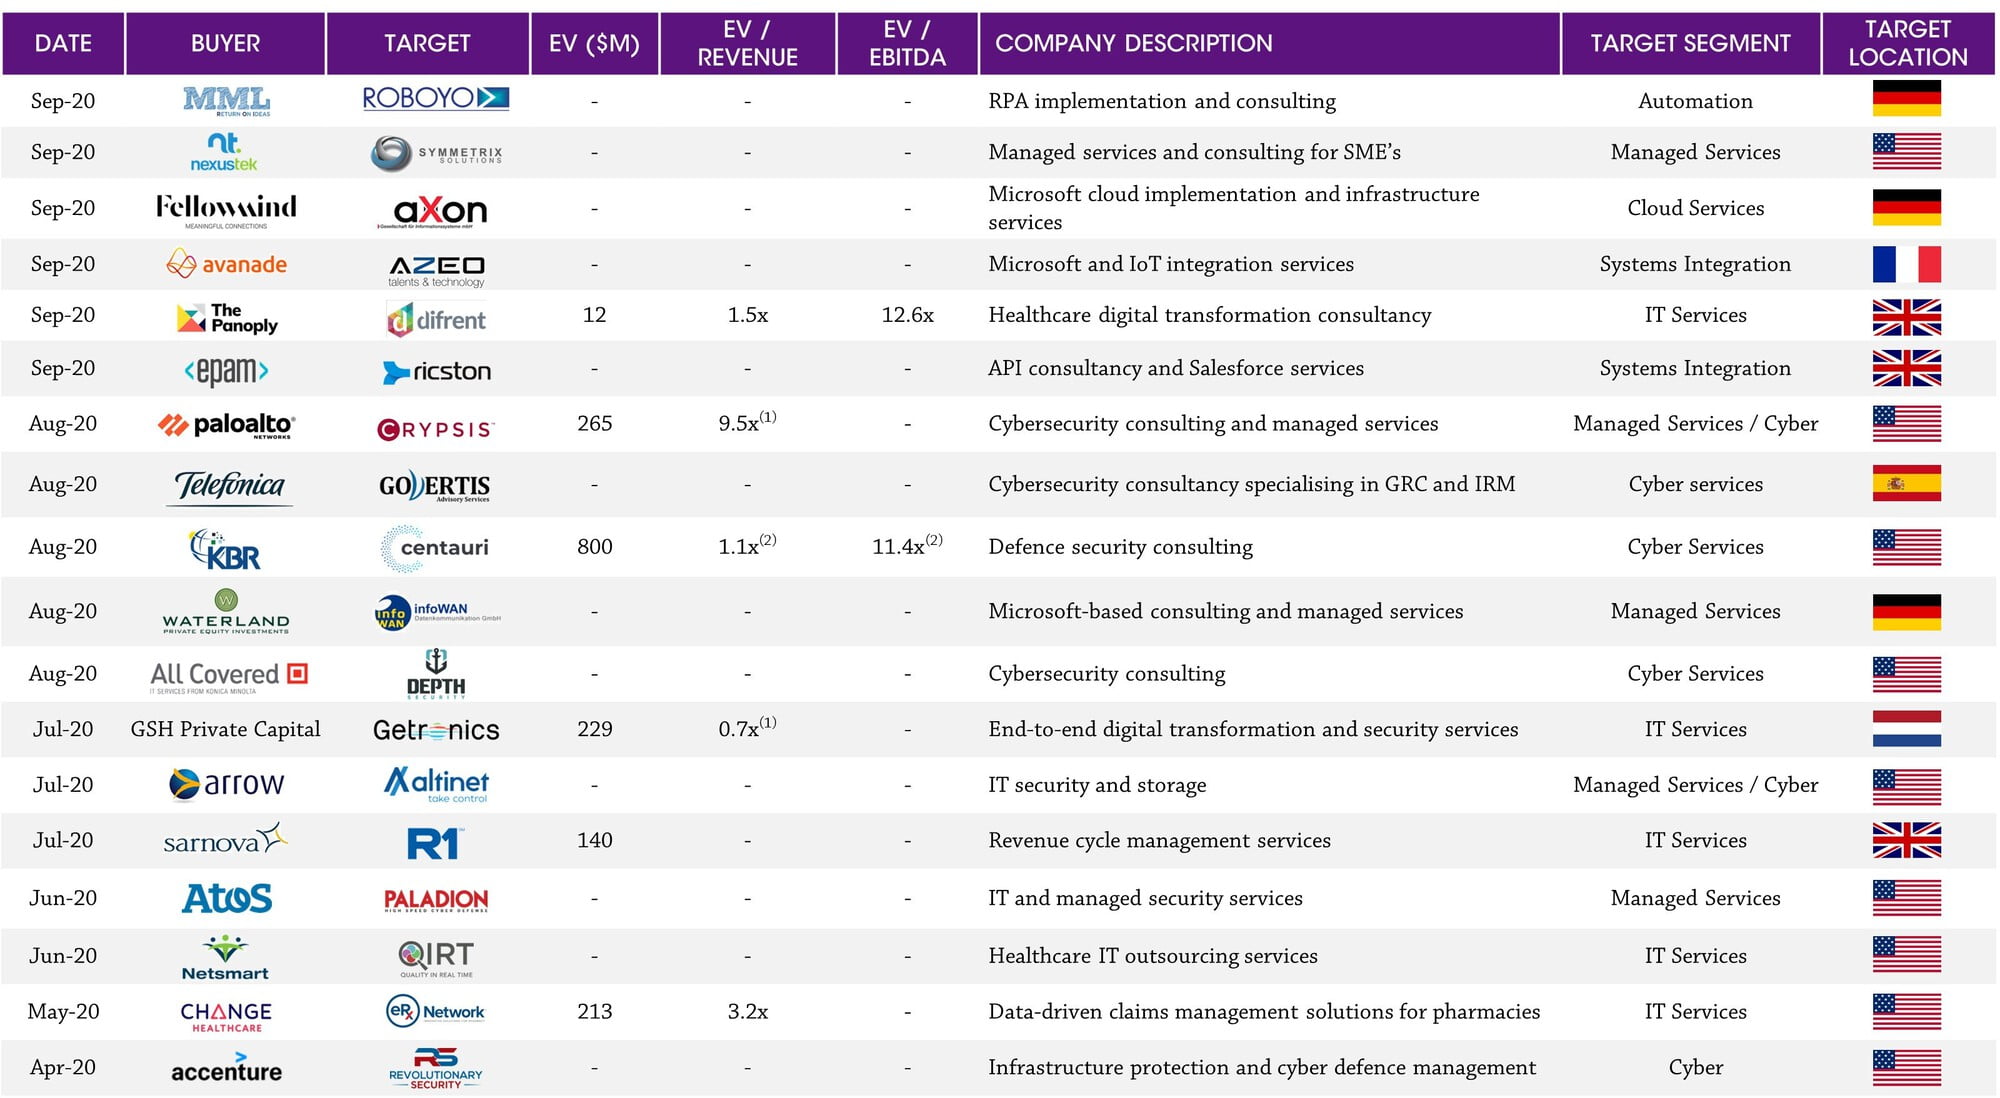
Note: In certain cases EV/Revenue and EV/EBITDA are publicly reported estimates; TTM financials have been used where possible; EV = transaction value scaled to 100% shareholding plus net debt (incl. minority interest) 1) Based on CY19 financials. 2) Based on FY21 estimates. Sources: Press releases, 451 Research and Results International analysis.
Note: Calendarised to December year end; $ millions, except share price data; multiples capped at 20x EV / Revenue and 50x EV / EBITDA; net debt includes minority interest. Source: Capital IQ.