The enterprise software market review: Q3 2020
Welcome to the Q3 2020 edition of our Enterprise Stack Report – Results International’s quarterly market update for the enterprise software sector.
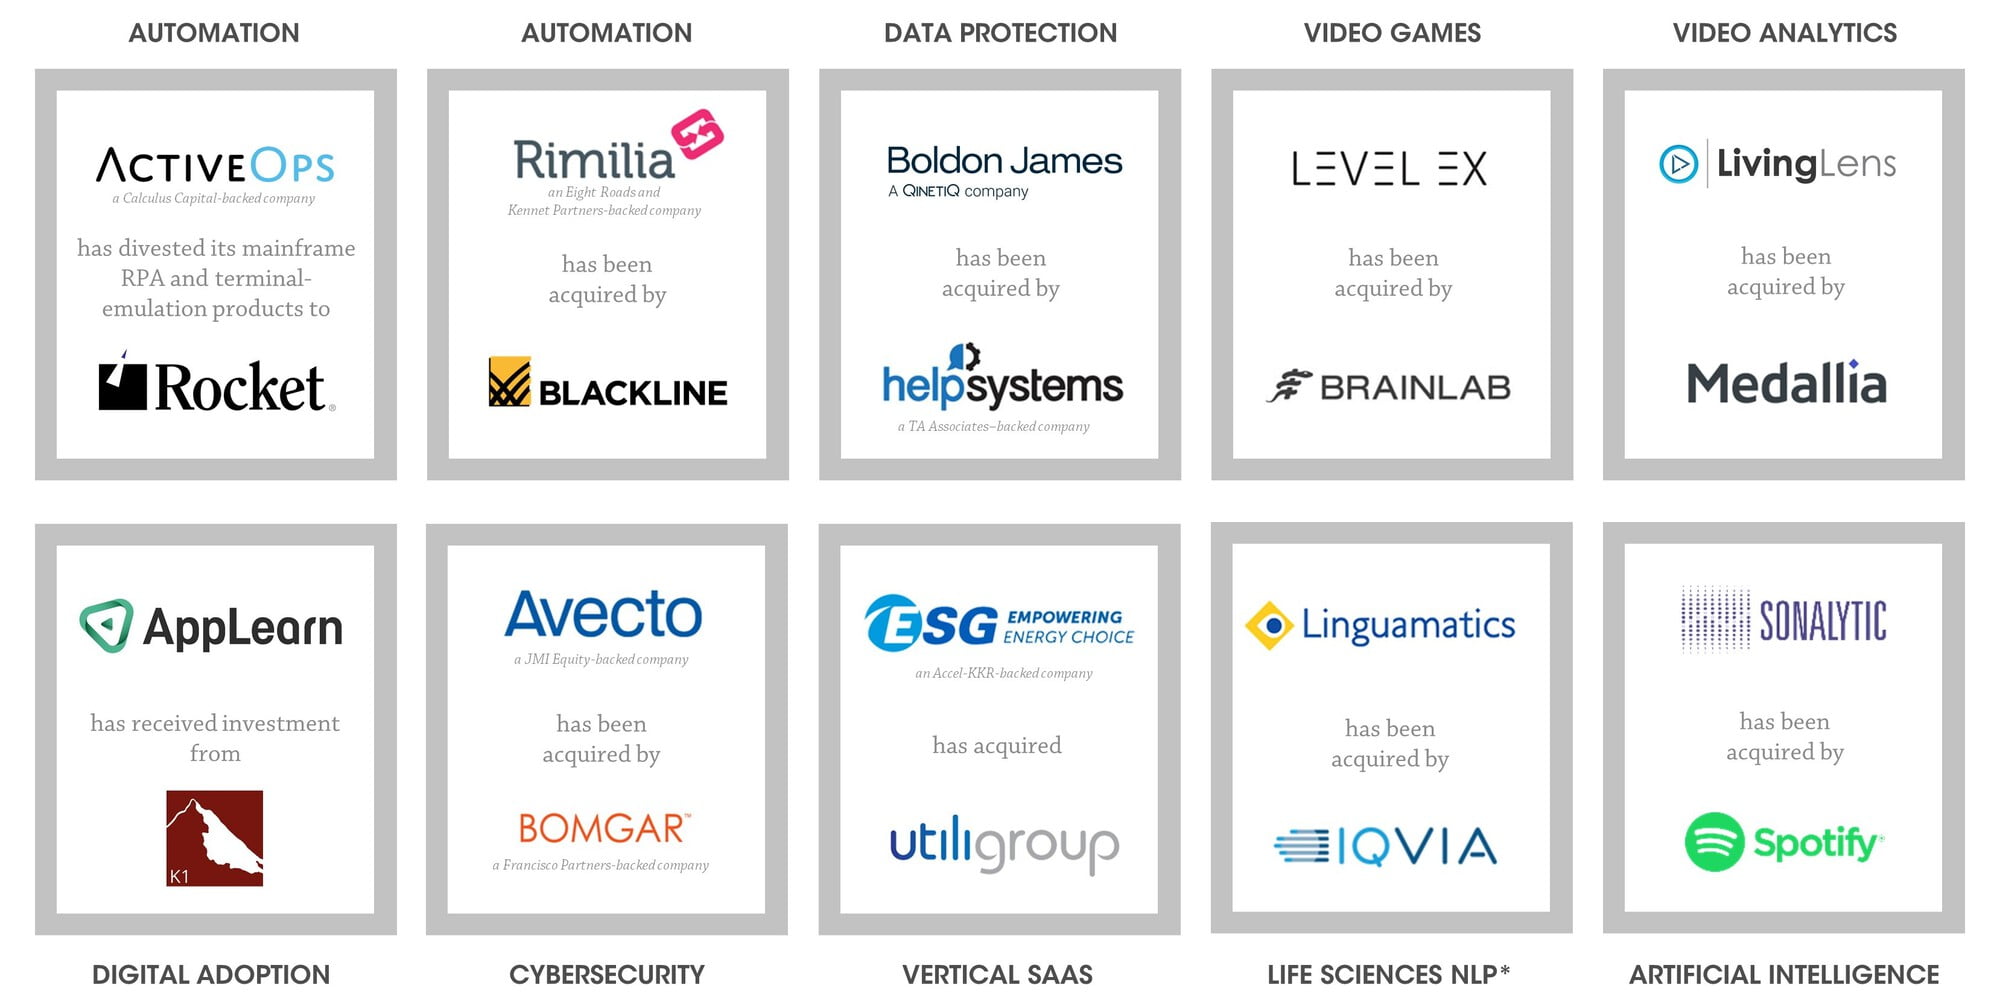
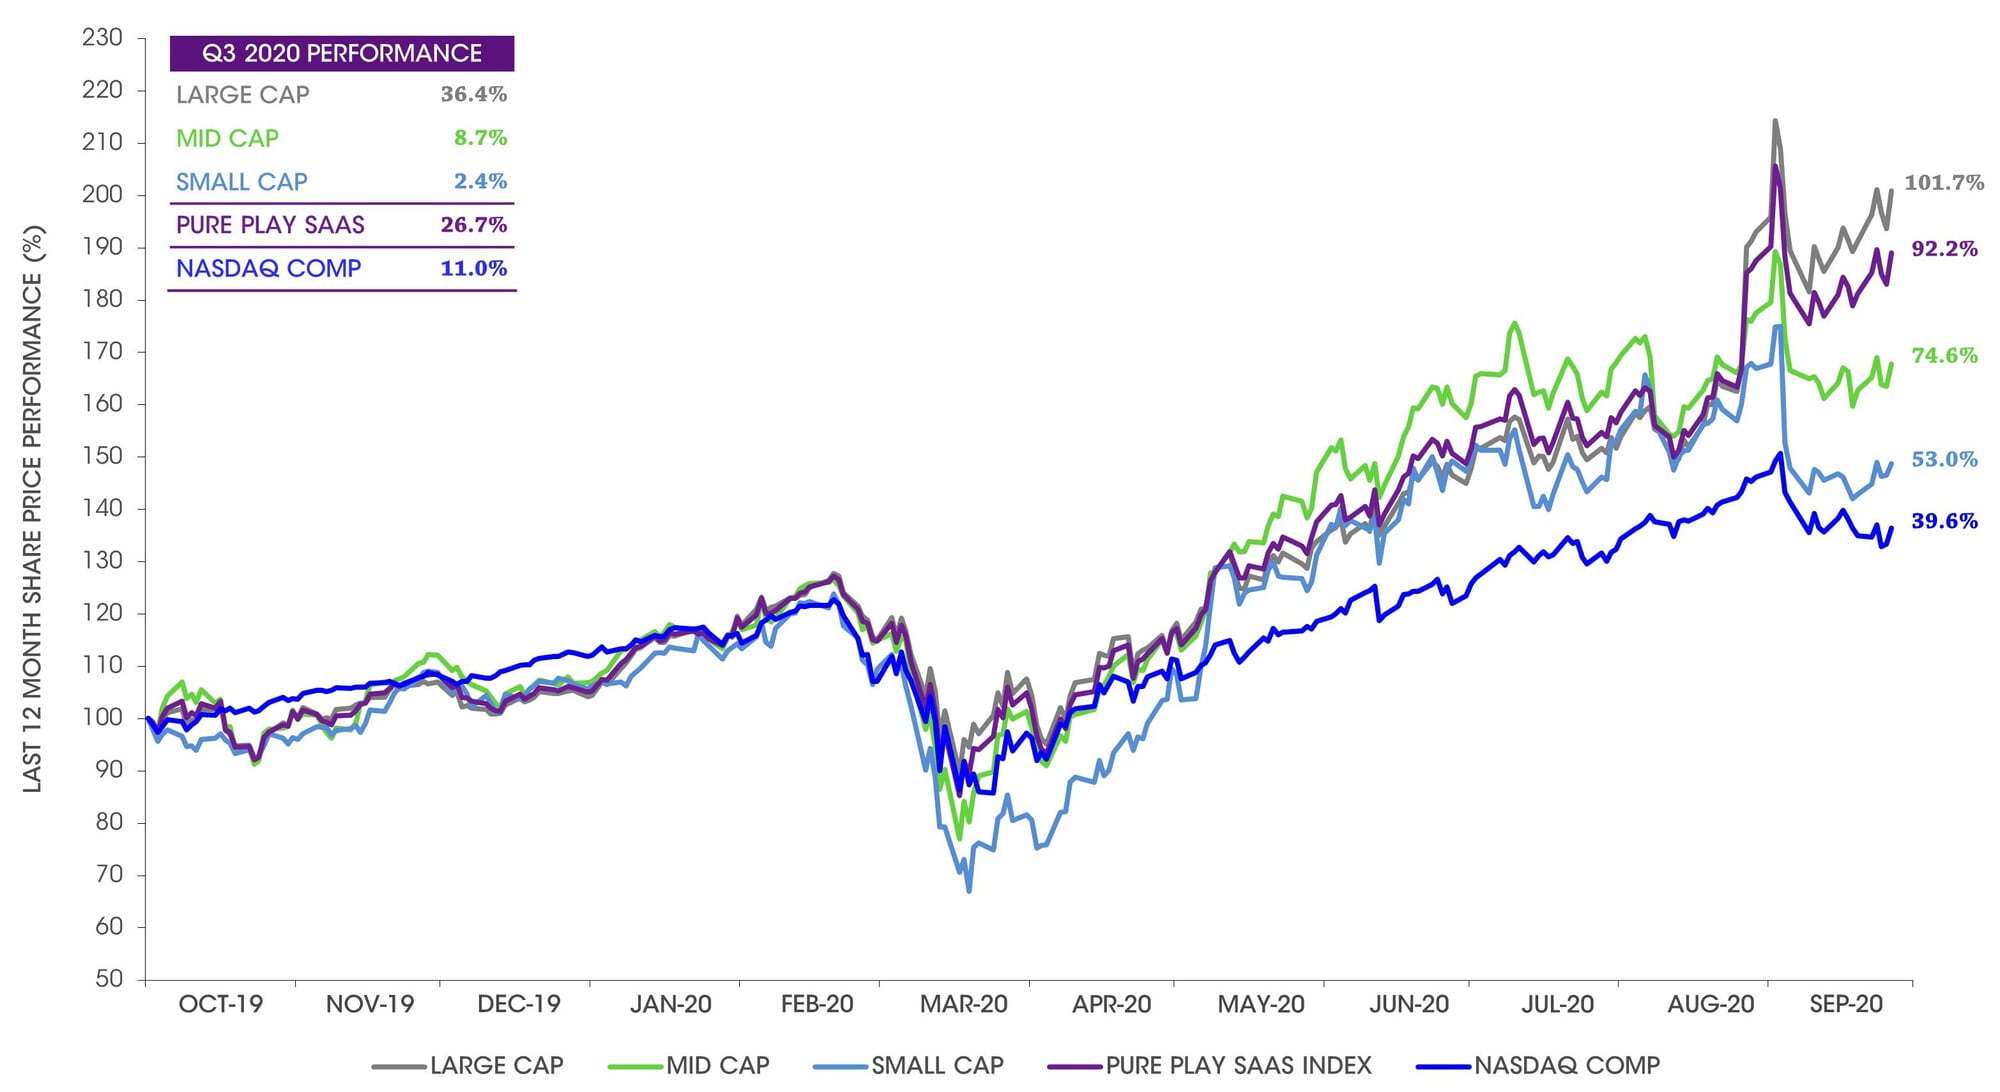
After a fall-off in valuations and a hiatus in deal activity in March/April 2020, enterprise software has performed very well and deal activity has been high. We’ve been pleased to advise on 5 transatlantic software deals year to date, reflecting continued high levels of interest from US strategics and PE in European software companies.
These are difficult times to be making predictions, but with the technology sector continuing to perform well through this unprecedented year, we expect to see a continuation of PE and strategic interest in acquisitions through the rest of 2020 and into 2021. We hope that you enjoy this document and look forward to discussing the data and underlying themes with you. If you are contemplating fundraising, exit or growth through acquisitions, please do get in touch.
*Natural Language Processing
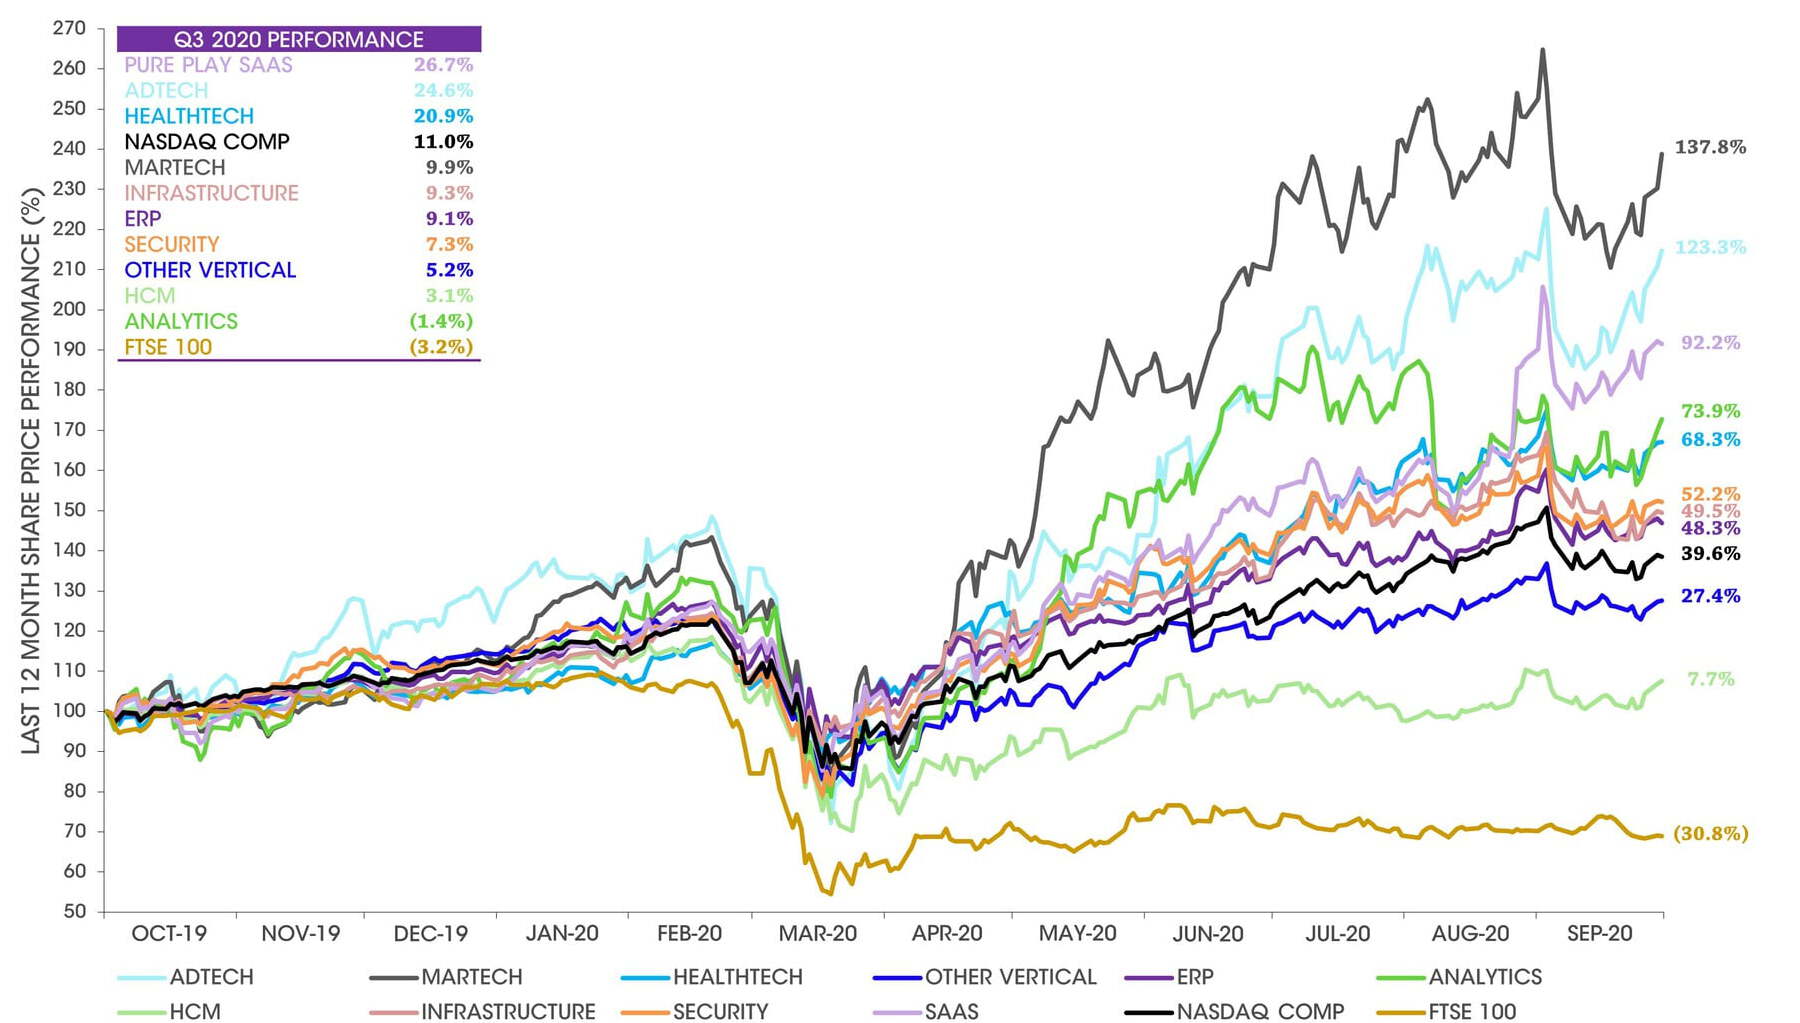
Notes: Based on share prices as at 30th September 2020; indices weighted by market capitalisation. Sources: Capital IQ and Results International analysis.
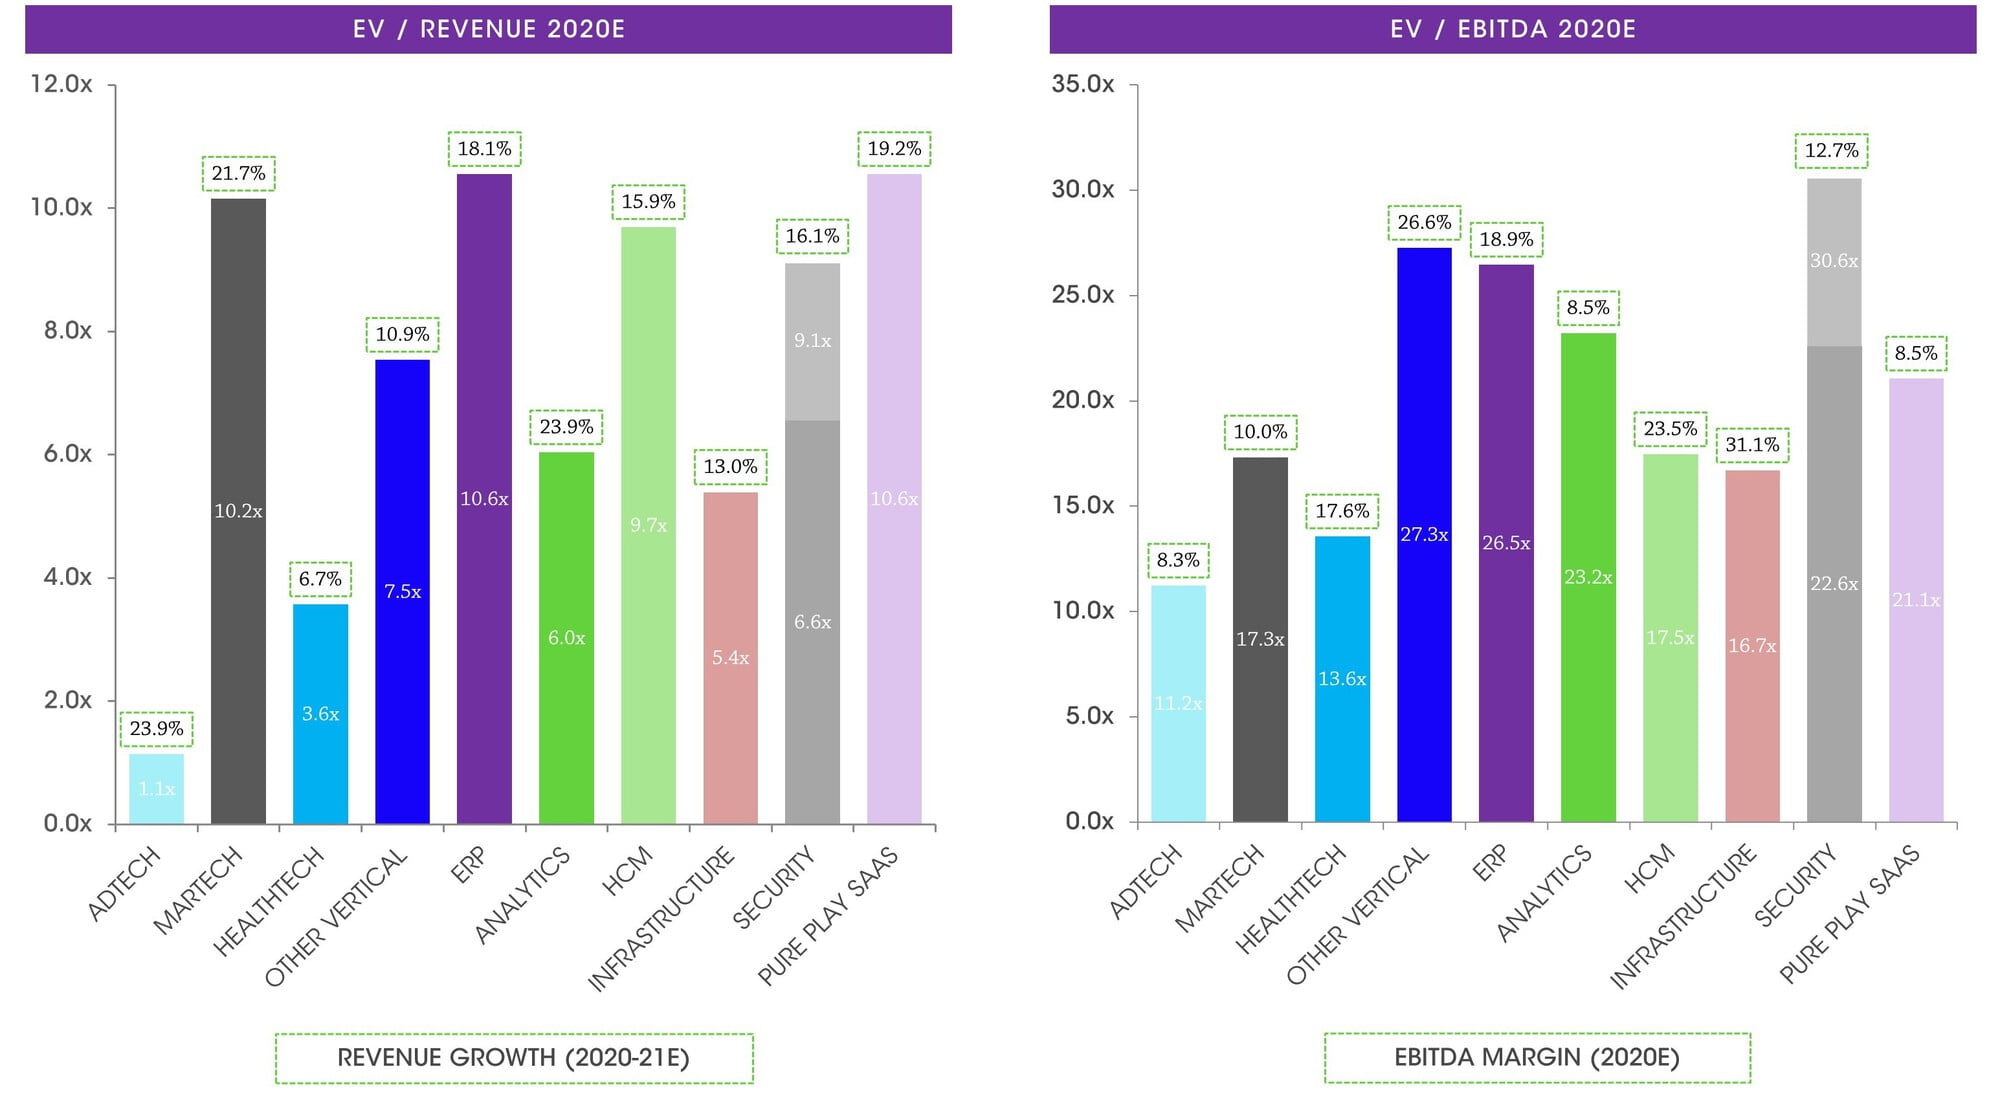
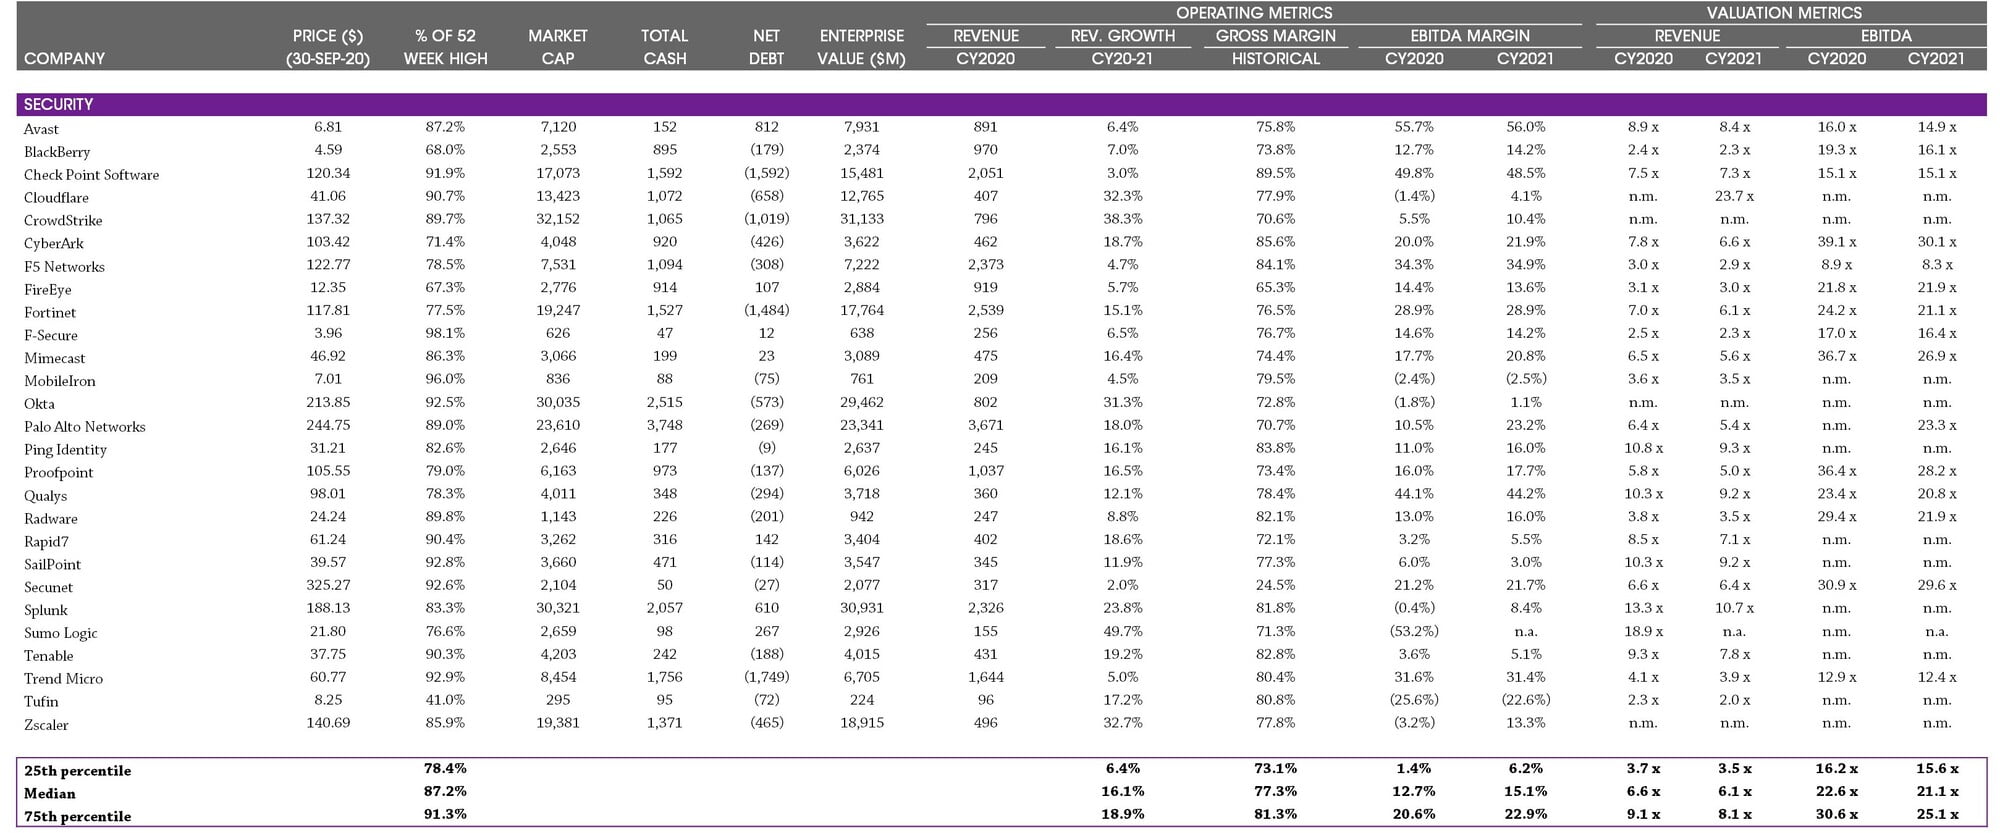
Note: For Security, 75th percentile values have been overlaid (shaded lighter) to illustrate next-generation vendors. Note: EV = Enterprise Value; financials calendarised to December year end; median values reported. See Selected Publicly Traded Companies (click here) for details of companies included in each category. Source: Capital IQ
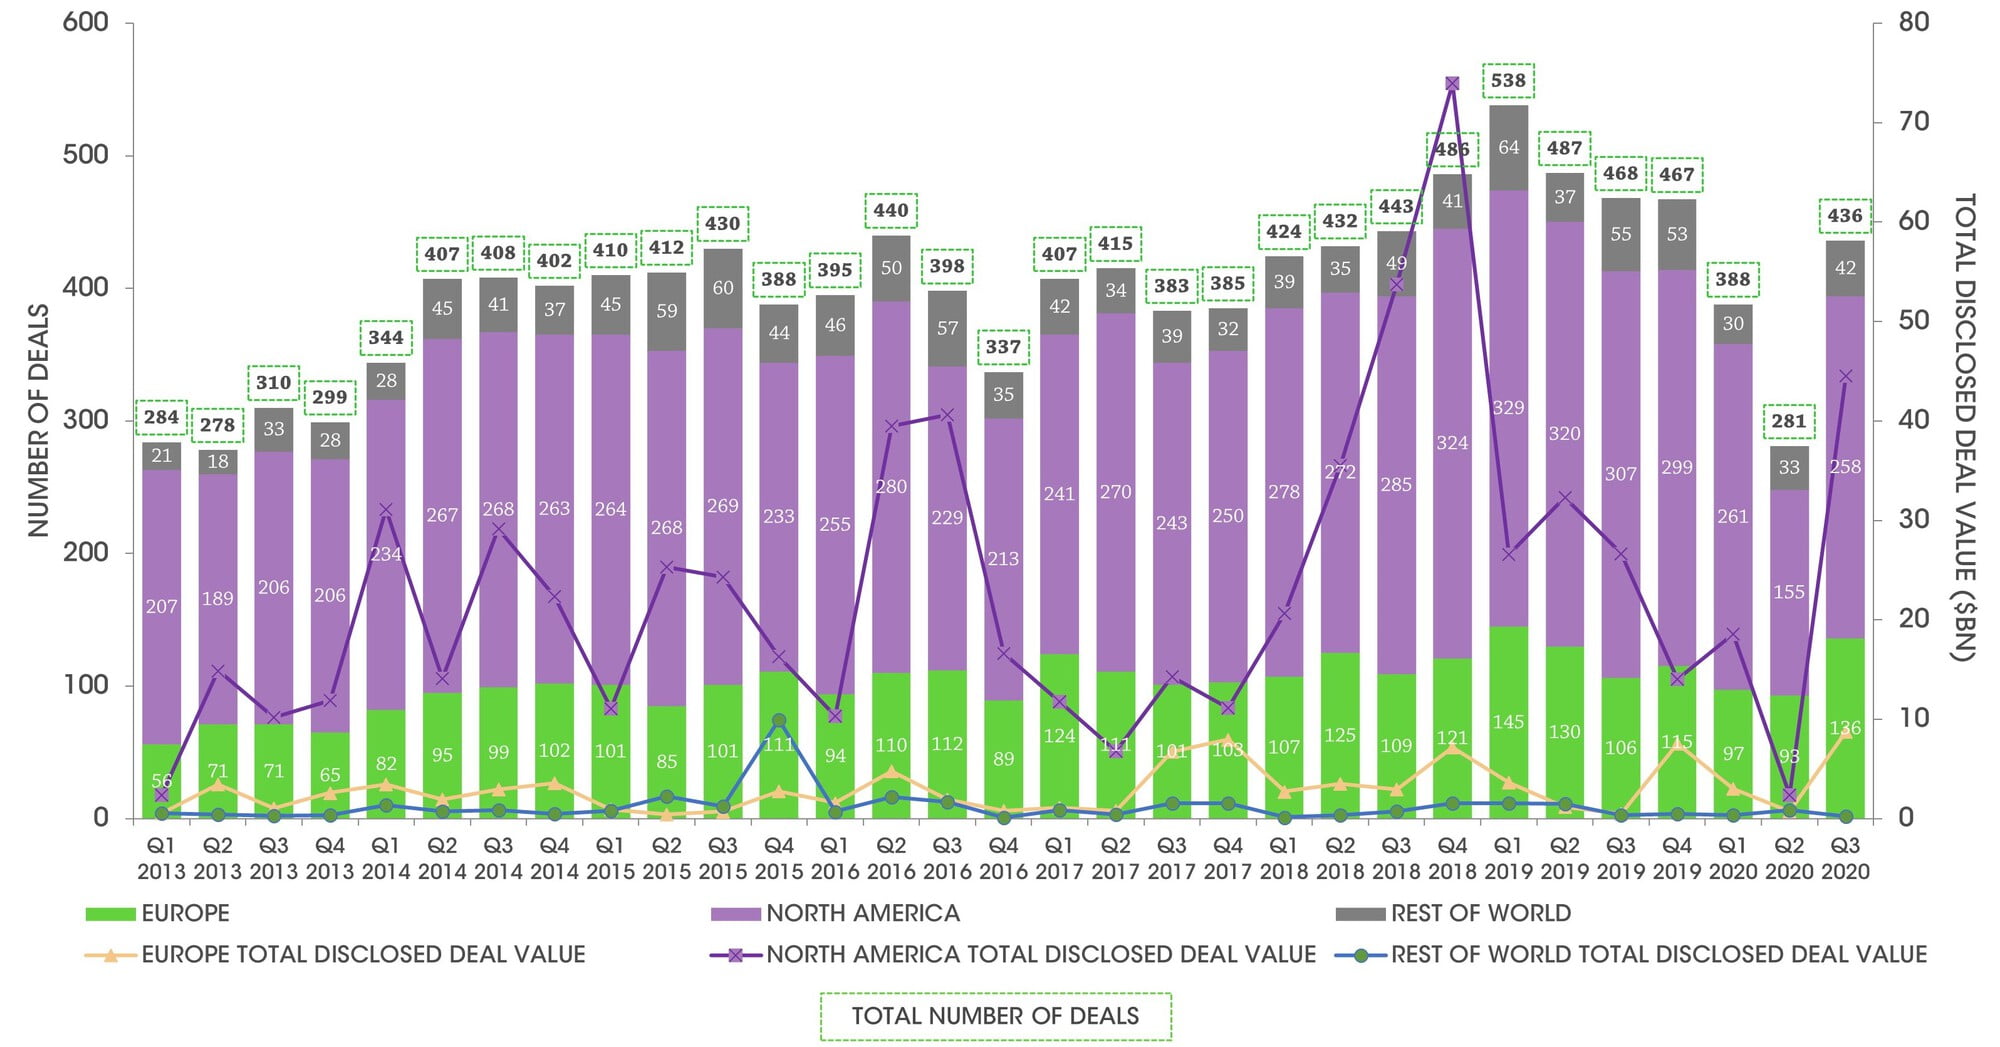
Sources: Press releases, Capital IQ, Mergermarket, 451 Research and Results International analysis.
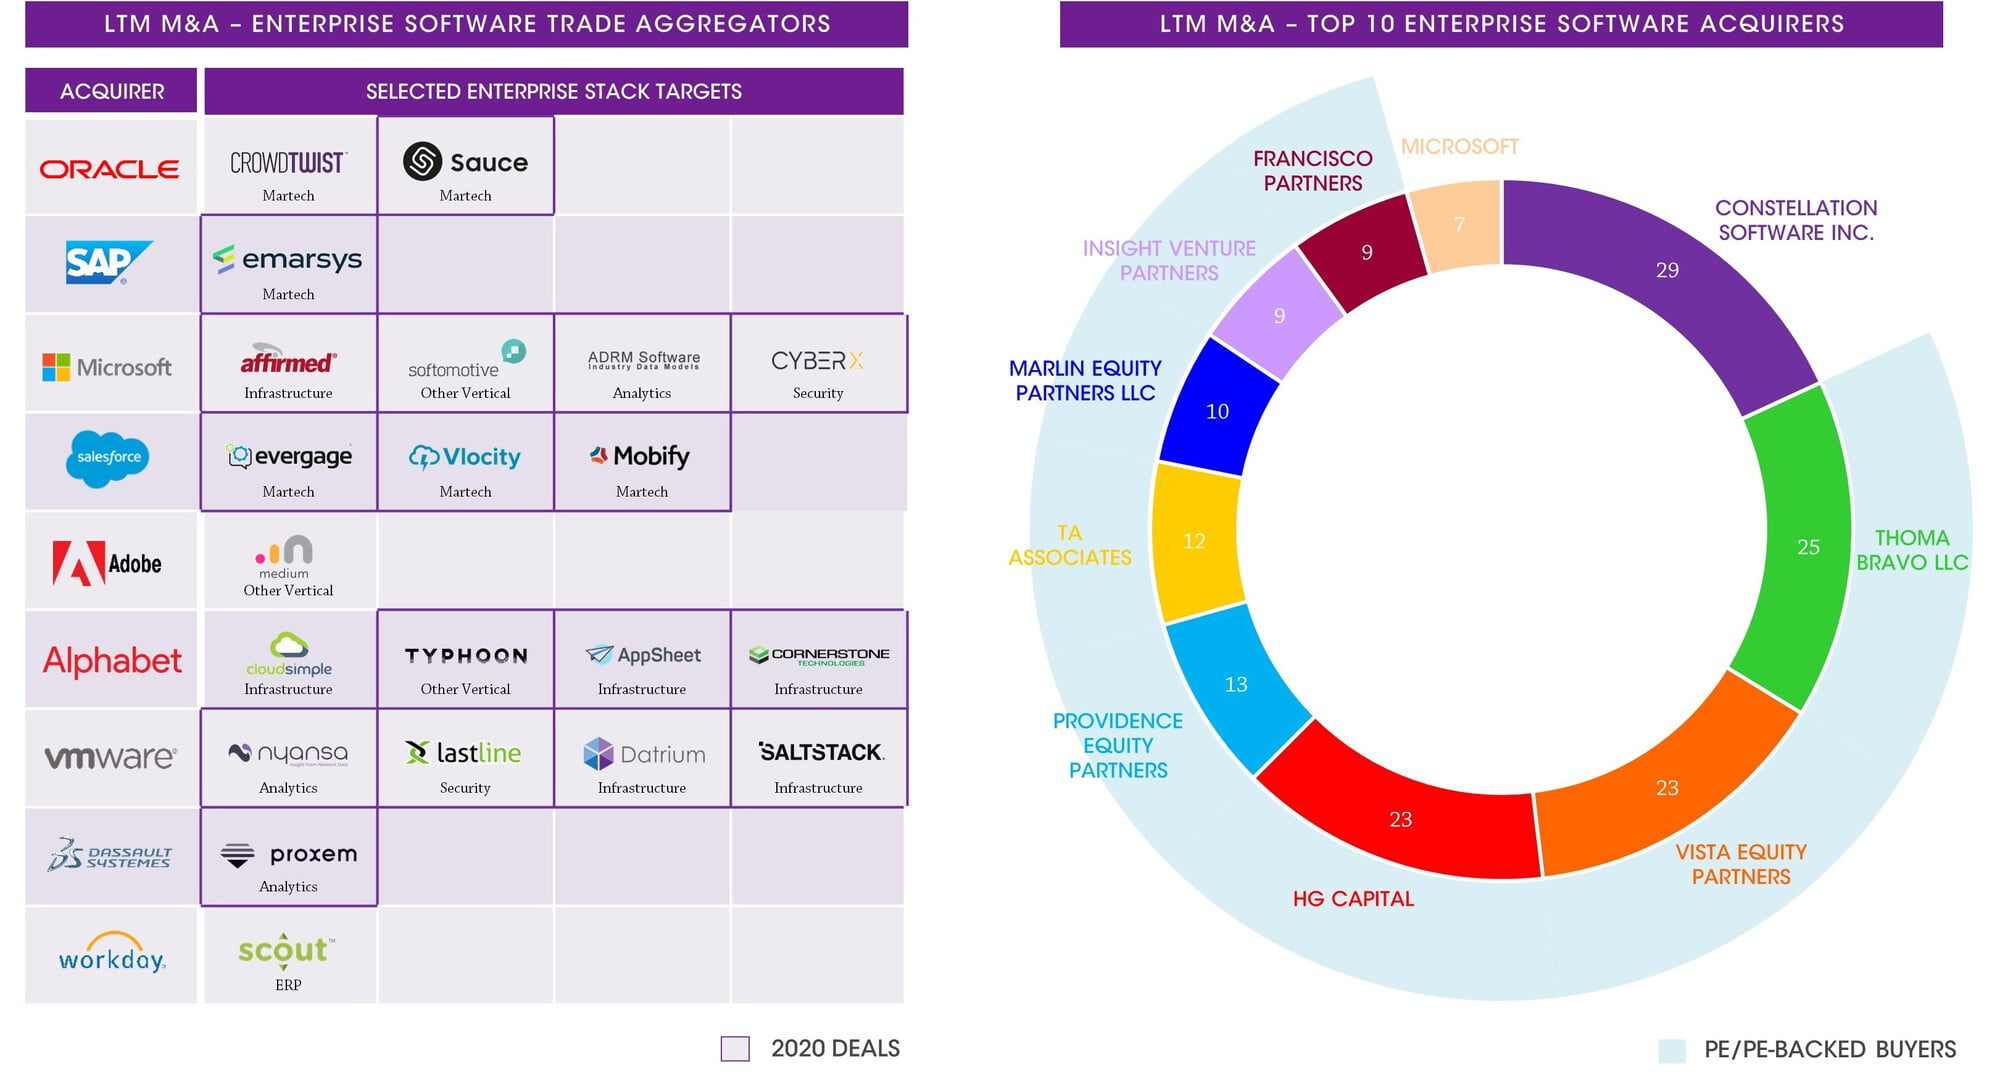
Note: PE also shown as acquirer when acquisitions made through portfolio company; parent also shown as acquirer when acquisition made through group subsidiary/ group. Sources: Press releases, Capital IQ, Mergermarket, 451 Research and Results International analysis.
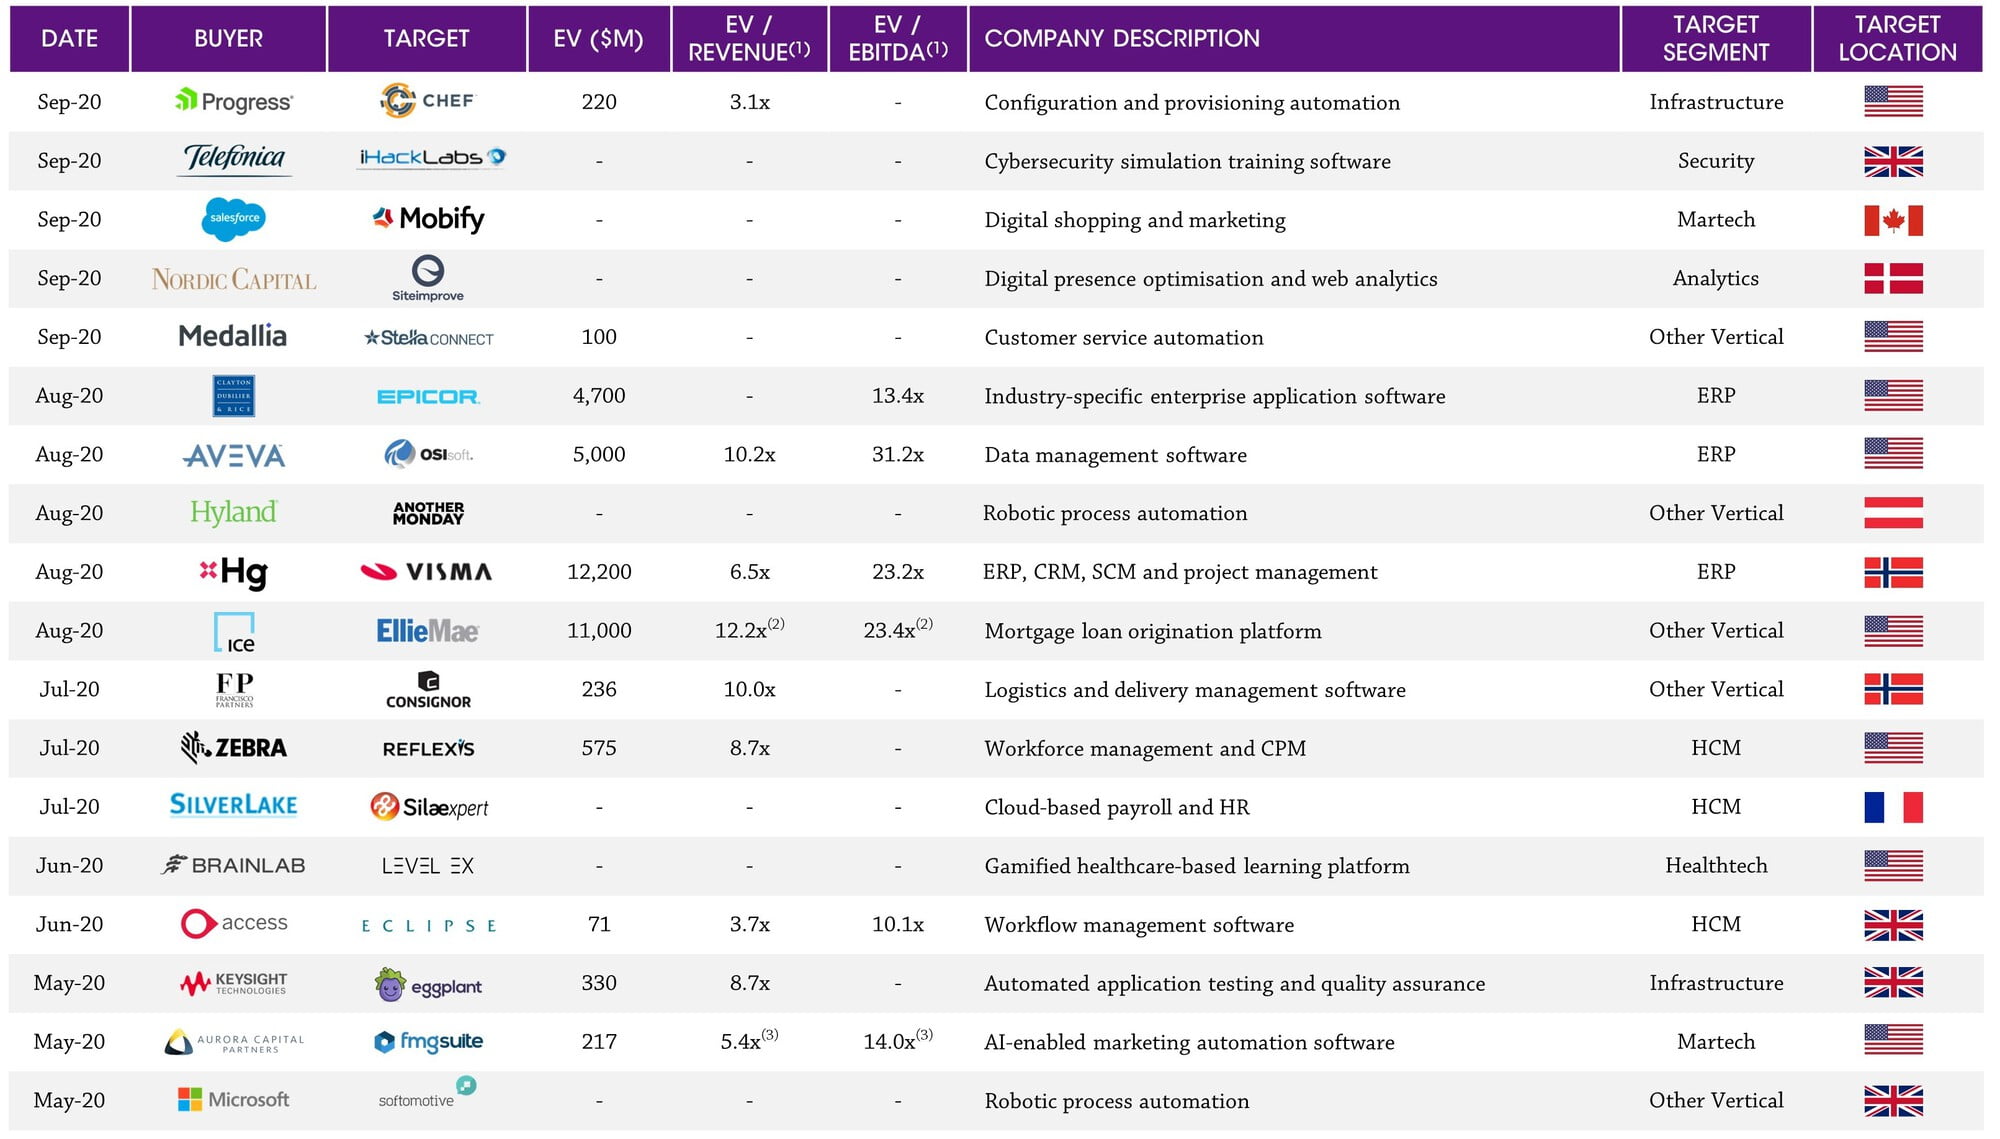
(1) In certain cases EV/Revenue and EV/EBITDA are publicly reported estimates; TTM financials have been used where possible; EV = transaction value scaled to 100% shareholding plus net debt (incl. minority interest) (2) Based on FY20 projected financials (3) Based on 451 estimates. Note: Earnout considerations excluded in the calculation of Enterprise Value. Sources: Press releases, 451 Research and Results International analysis.
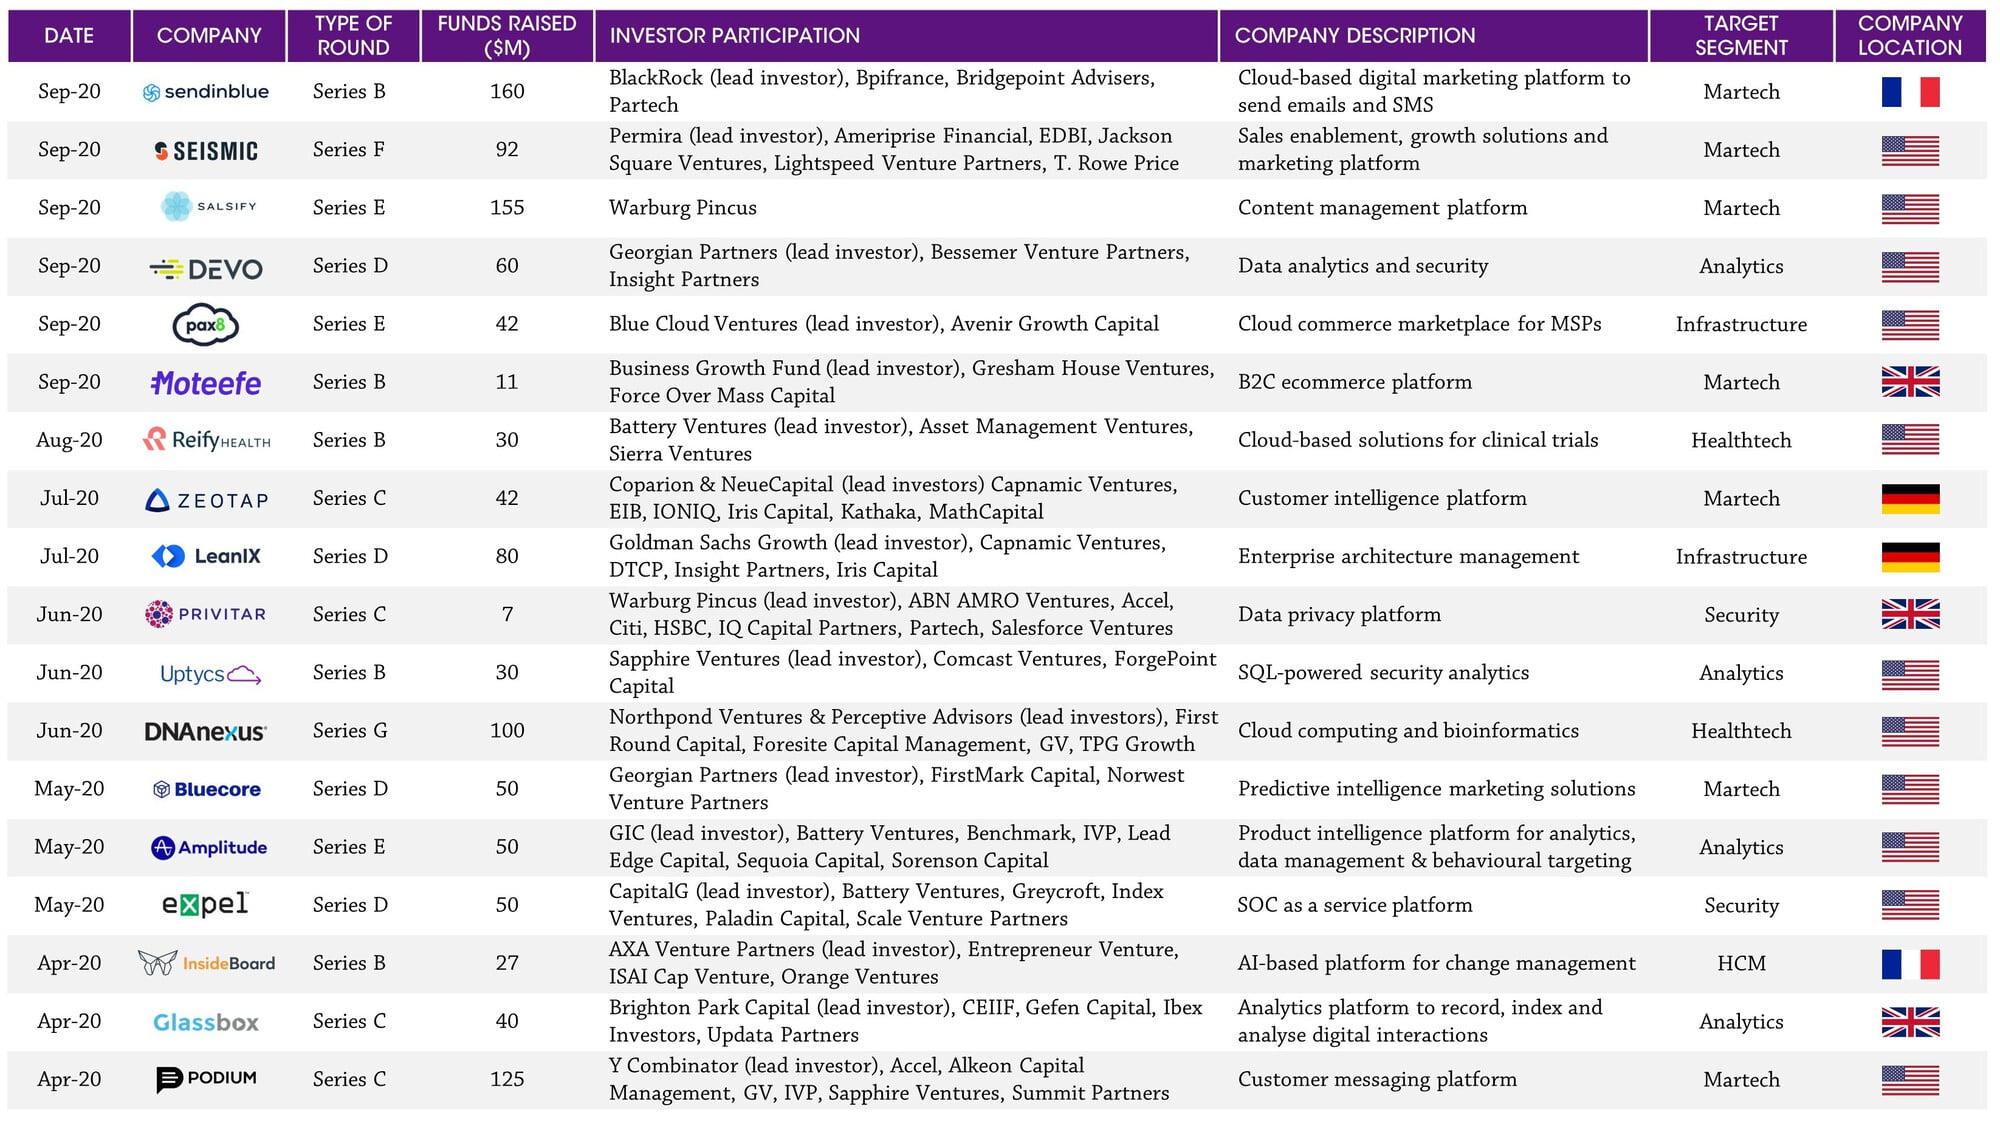
Sources: Pitchbook, Press releases, Crunchbase and Results International analysis
Notes: Based on share prices as at 30th September 2020; indices weighted by market capitalisation. Sources: Capital IQ and Results International analysis
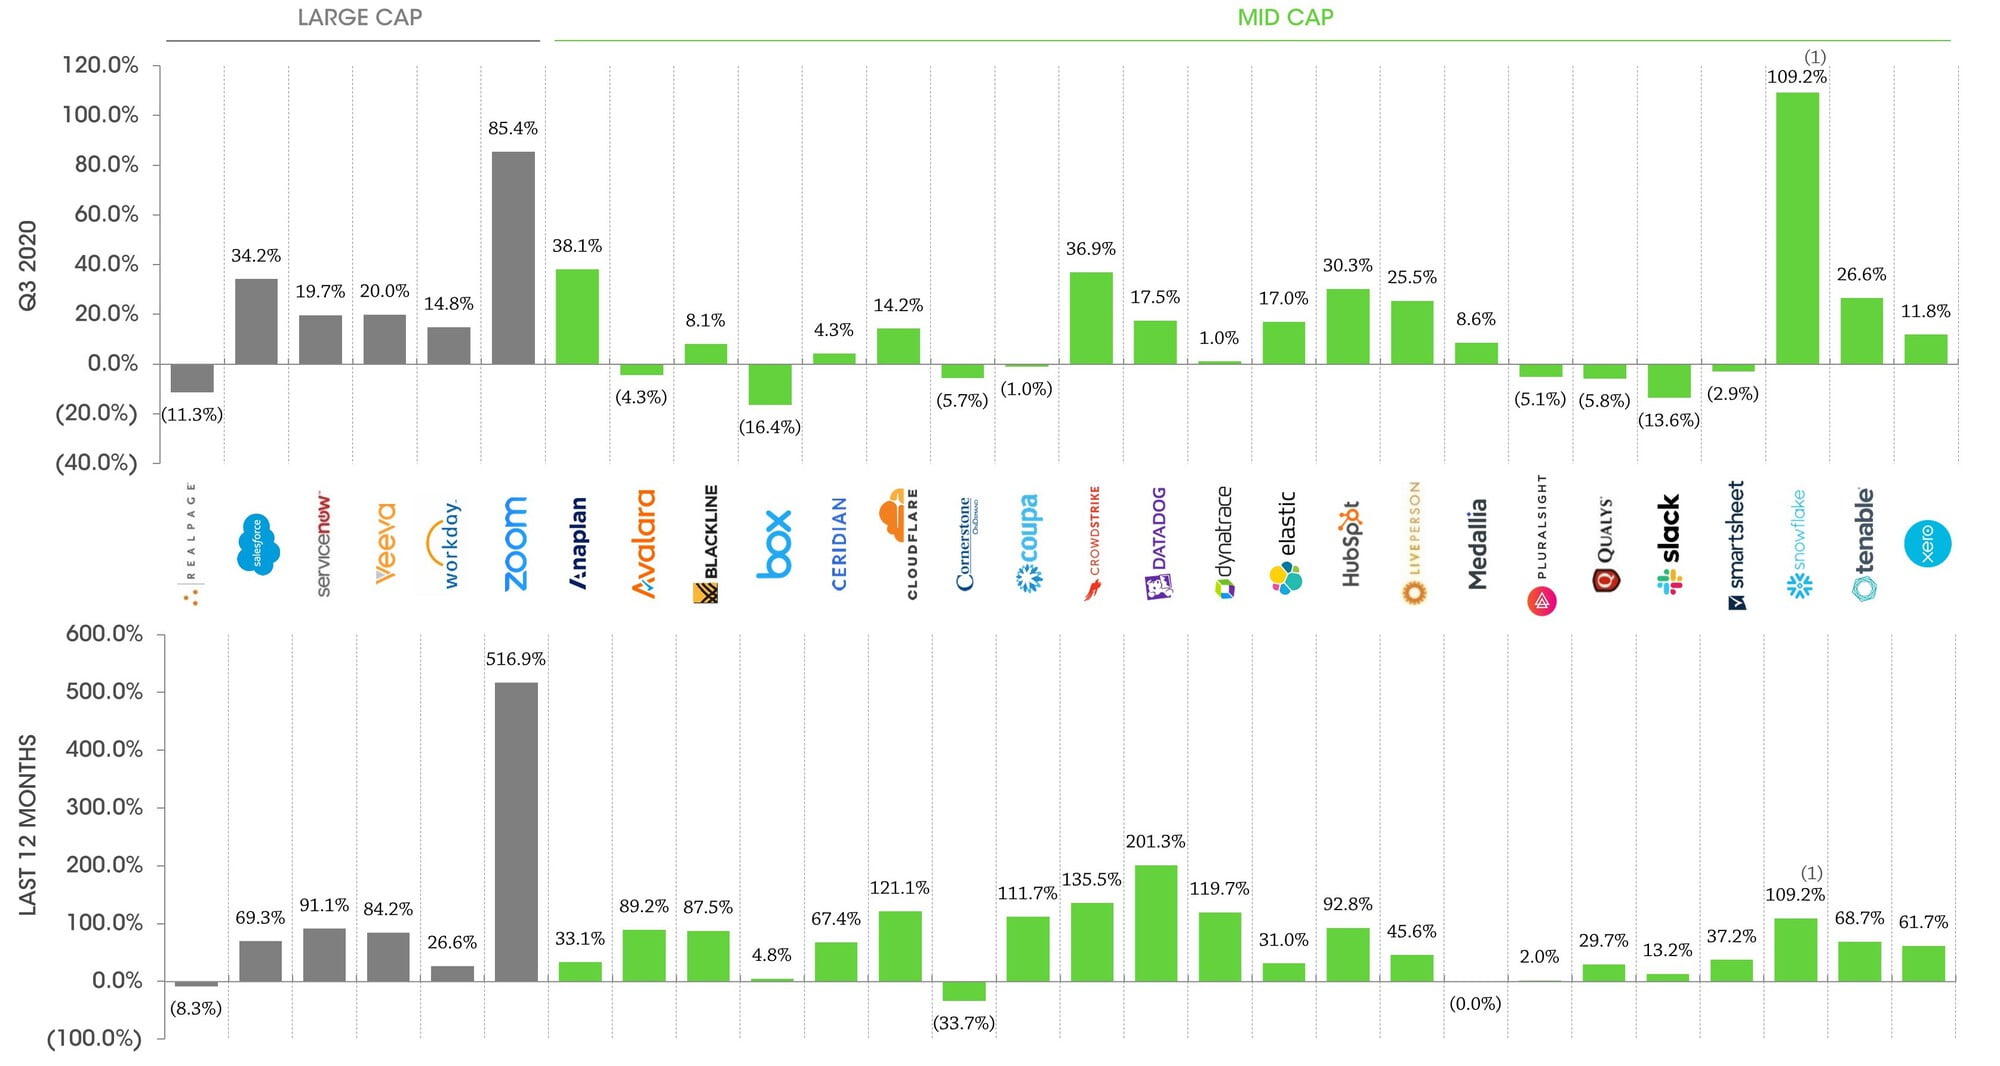
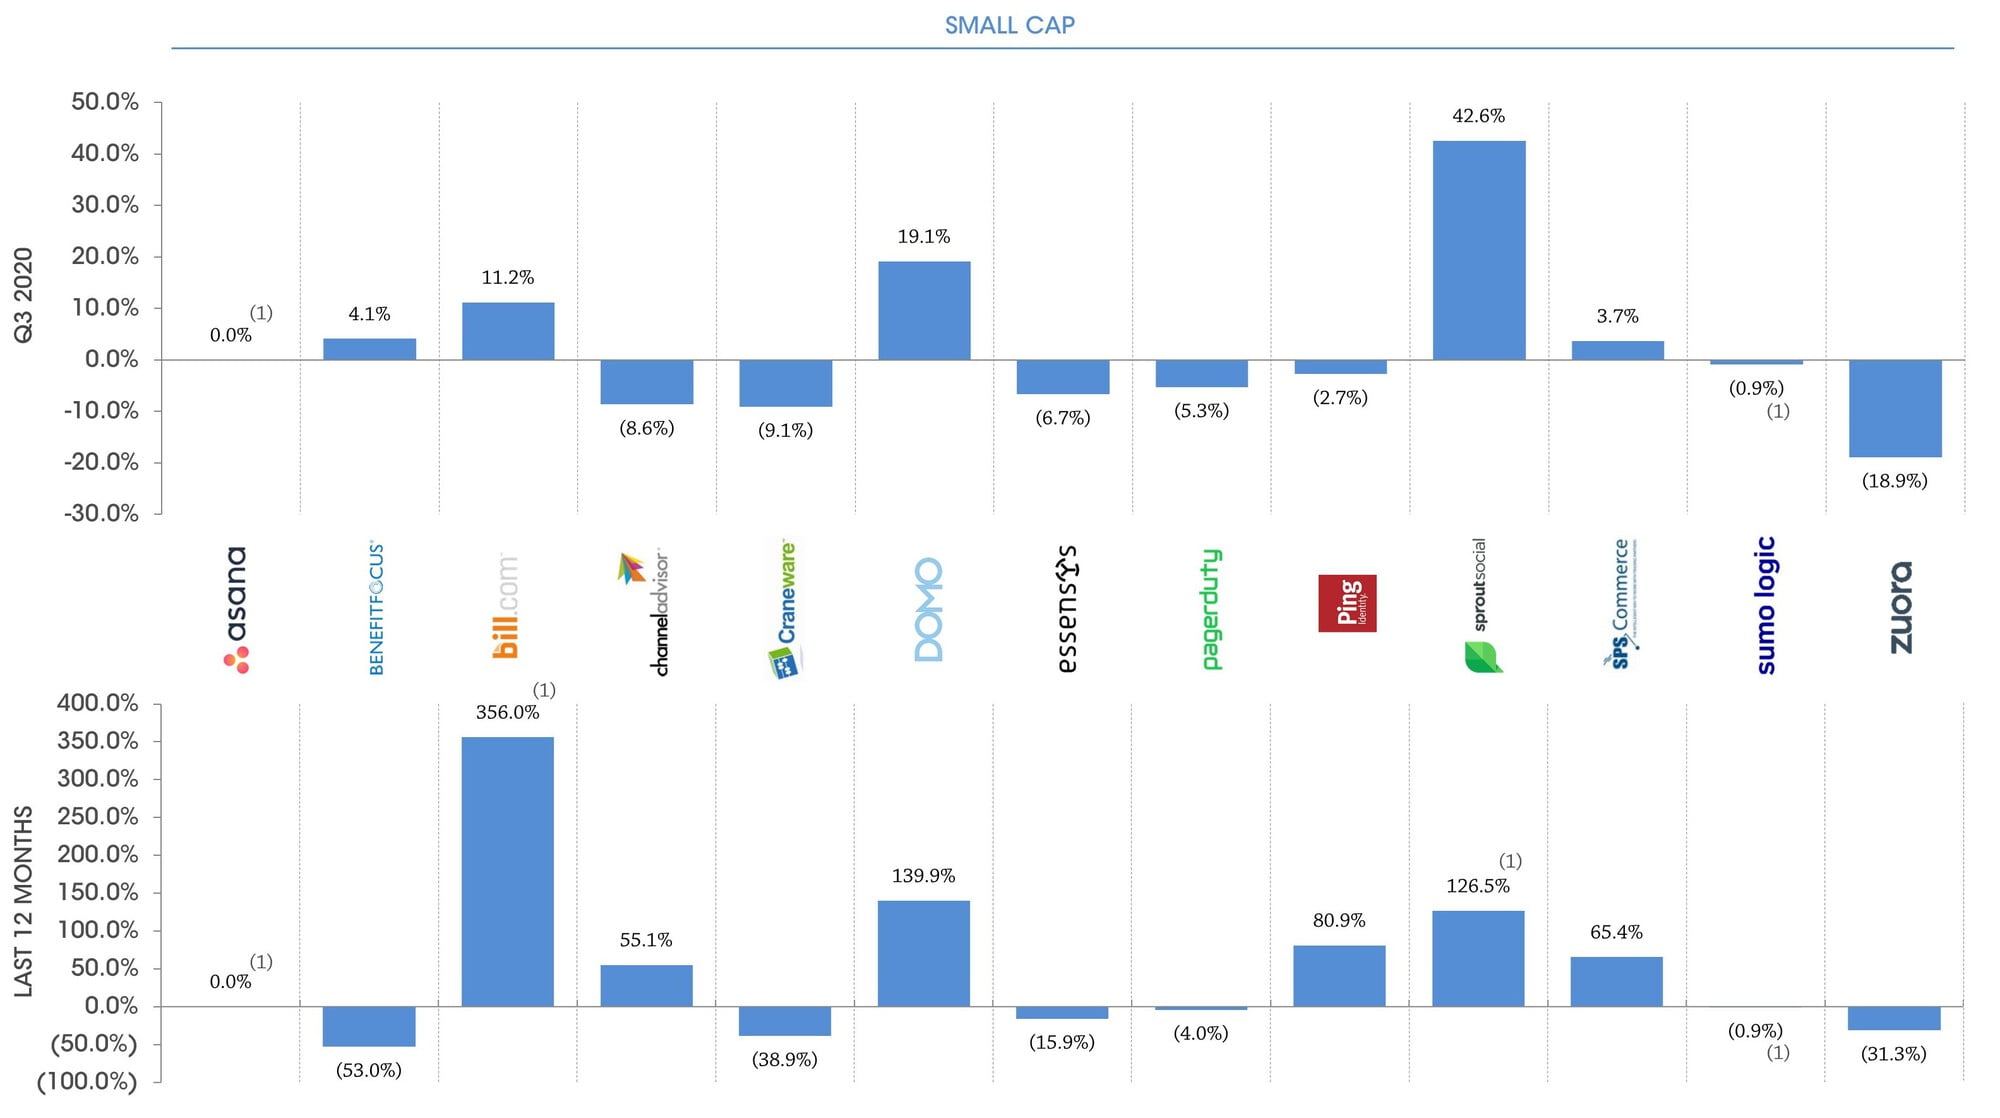
(1) This company IPO’d within the last 12 months/last quarter, the share price movement represents the change between the stock’s IPO date and 30th September 2020. Note: Based on share prices as at 30th September 2020. Sources: Capital IQ and Results International analysis.
(1) These companies IPO’d within the last 12 months /last quarter, the share price movement represents the change between the stock’s IPO date and 30th September 2020. Note: Based on share prices as at 30th September 2020. Sources: Capital IQ and Results International analysis.
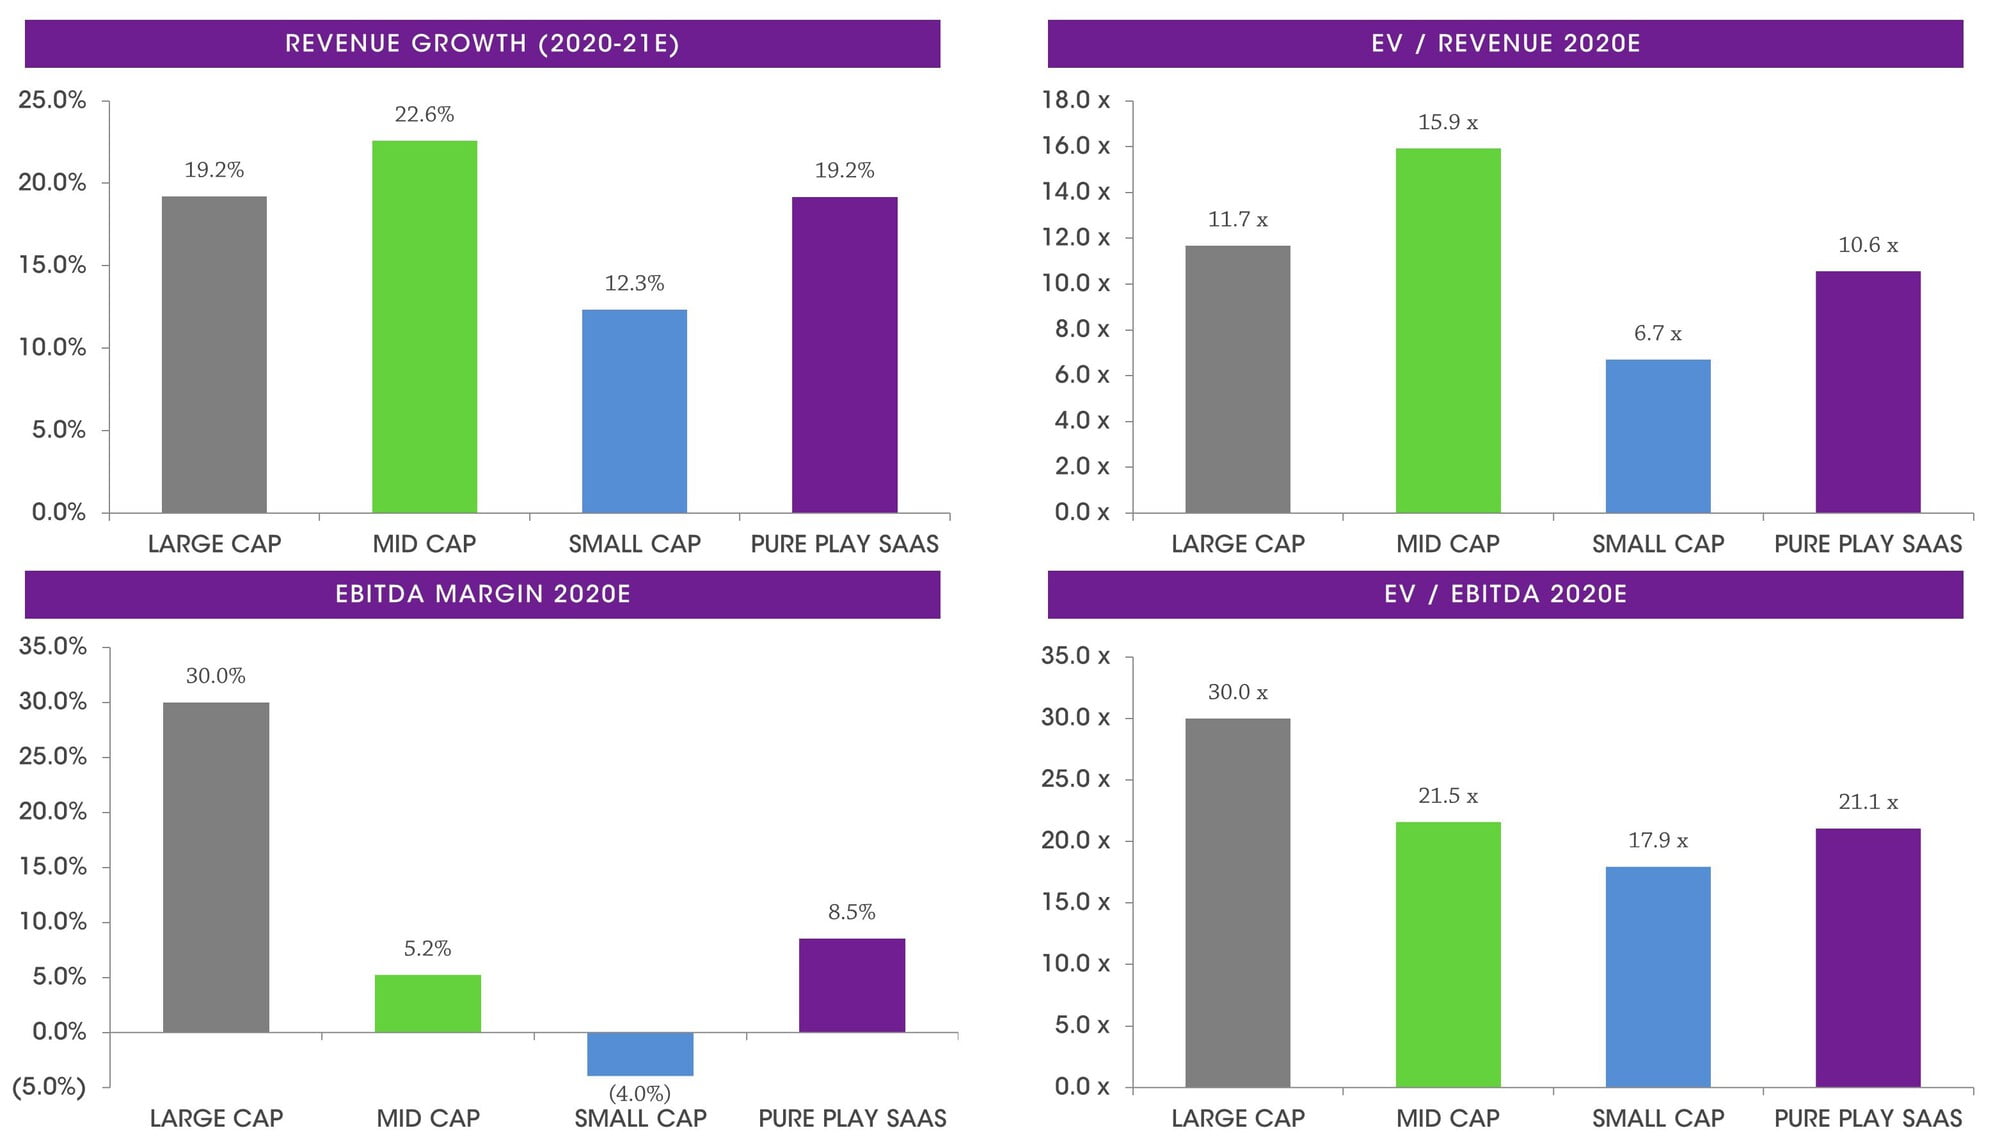
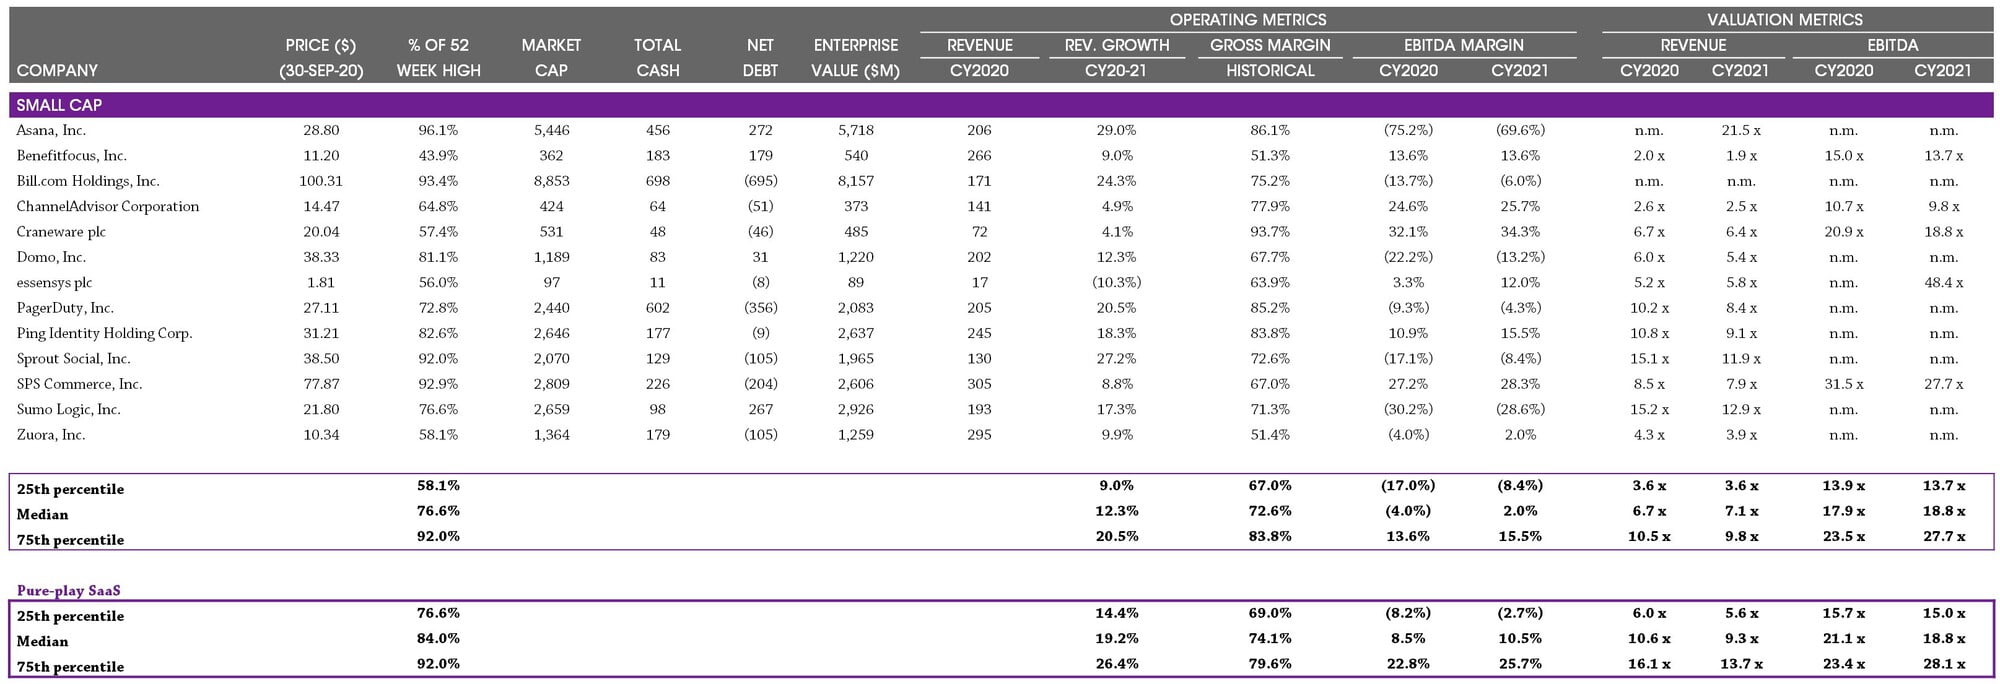
1) Pure play SaaS represents the median of all stocks in Large Cap, Mid Cap and Small Cap, with no weighting applied. Notes: EV = Enterprise Value; financials calendarised to December year end; median values reported. See Selected Publicly Traded Companies (click here) for details of companies included in each category. Sources: Capital IQ and analyst reports.
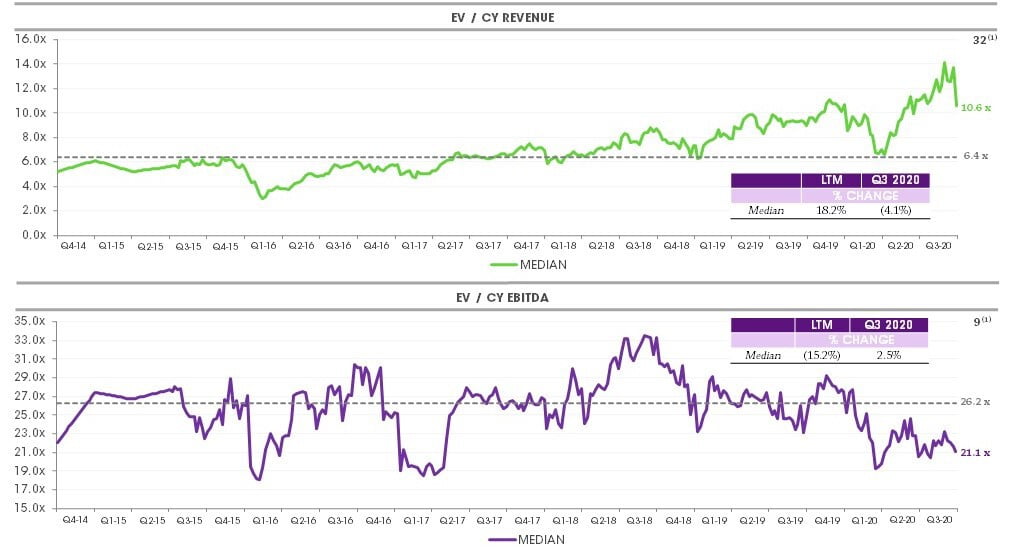
(1) Number of companies with applicable multiples in Q3 2020 index. Notes: EV = Enterprise Value; financials calendarised to December year end, which can impact the multiples at the start of each year as the base is shifted forward; weekly tracking of valuation multiples commenced in July 2015, October 2014 – June 2015 tracked on a quarterly basis, therefore a linear progression has been assumed between quarters up to July 2015. Dotted line represents median since data has been tracked. Source: Capital IQ.
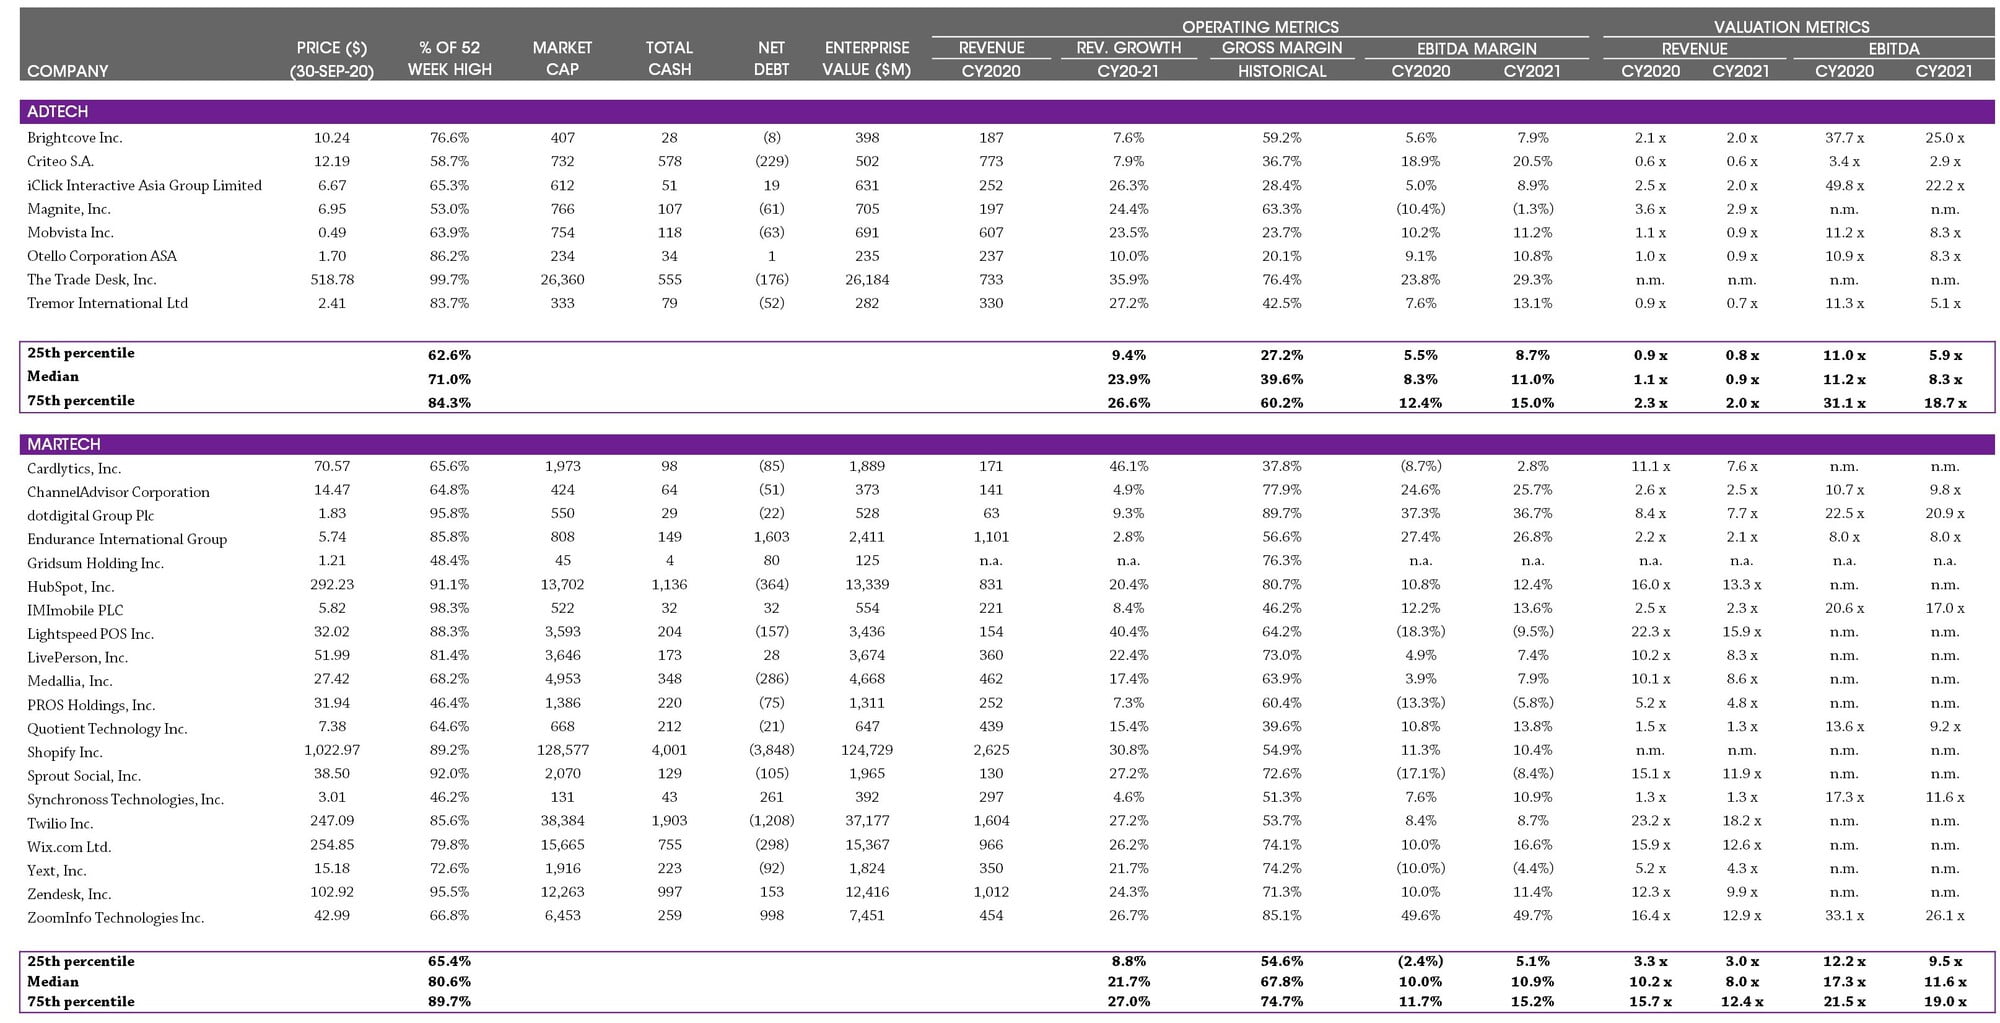
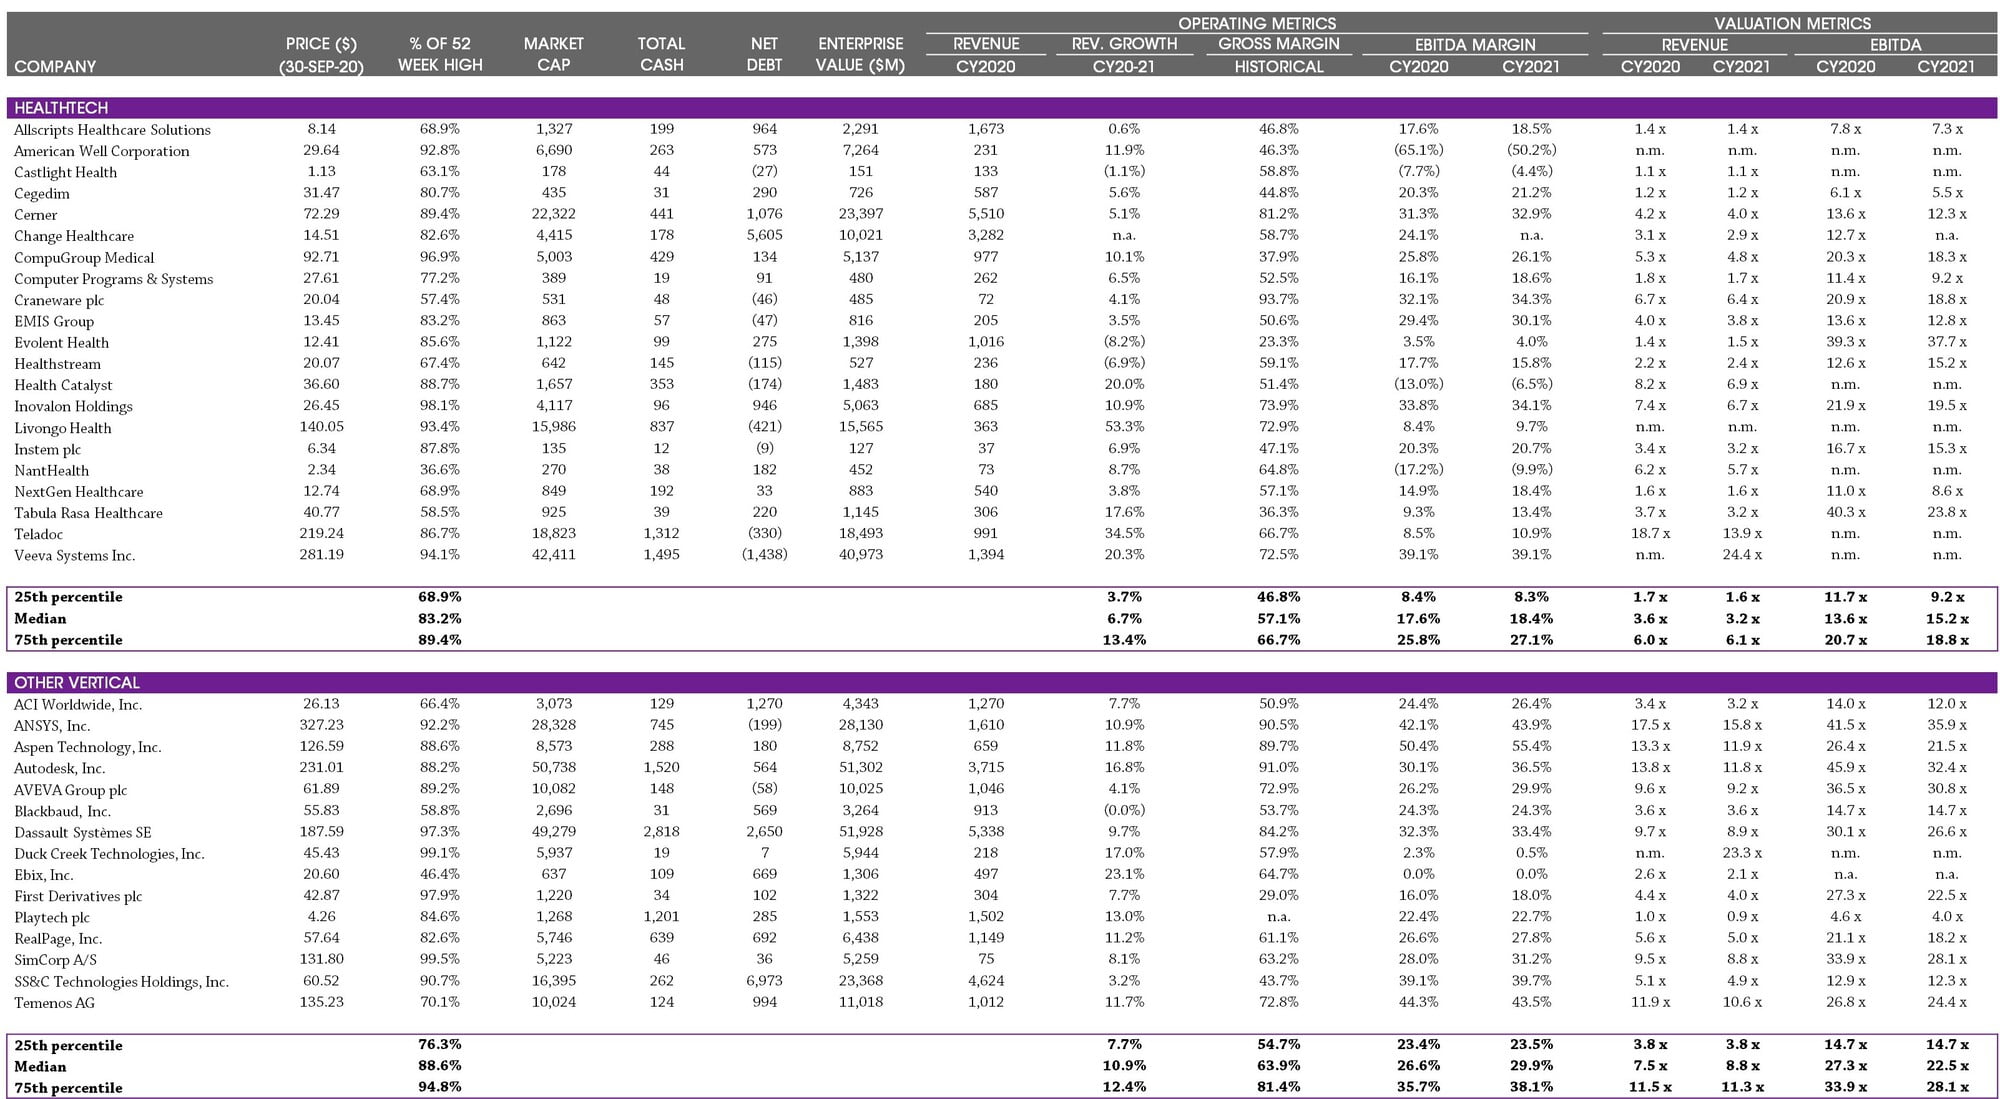
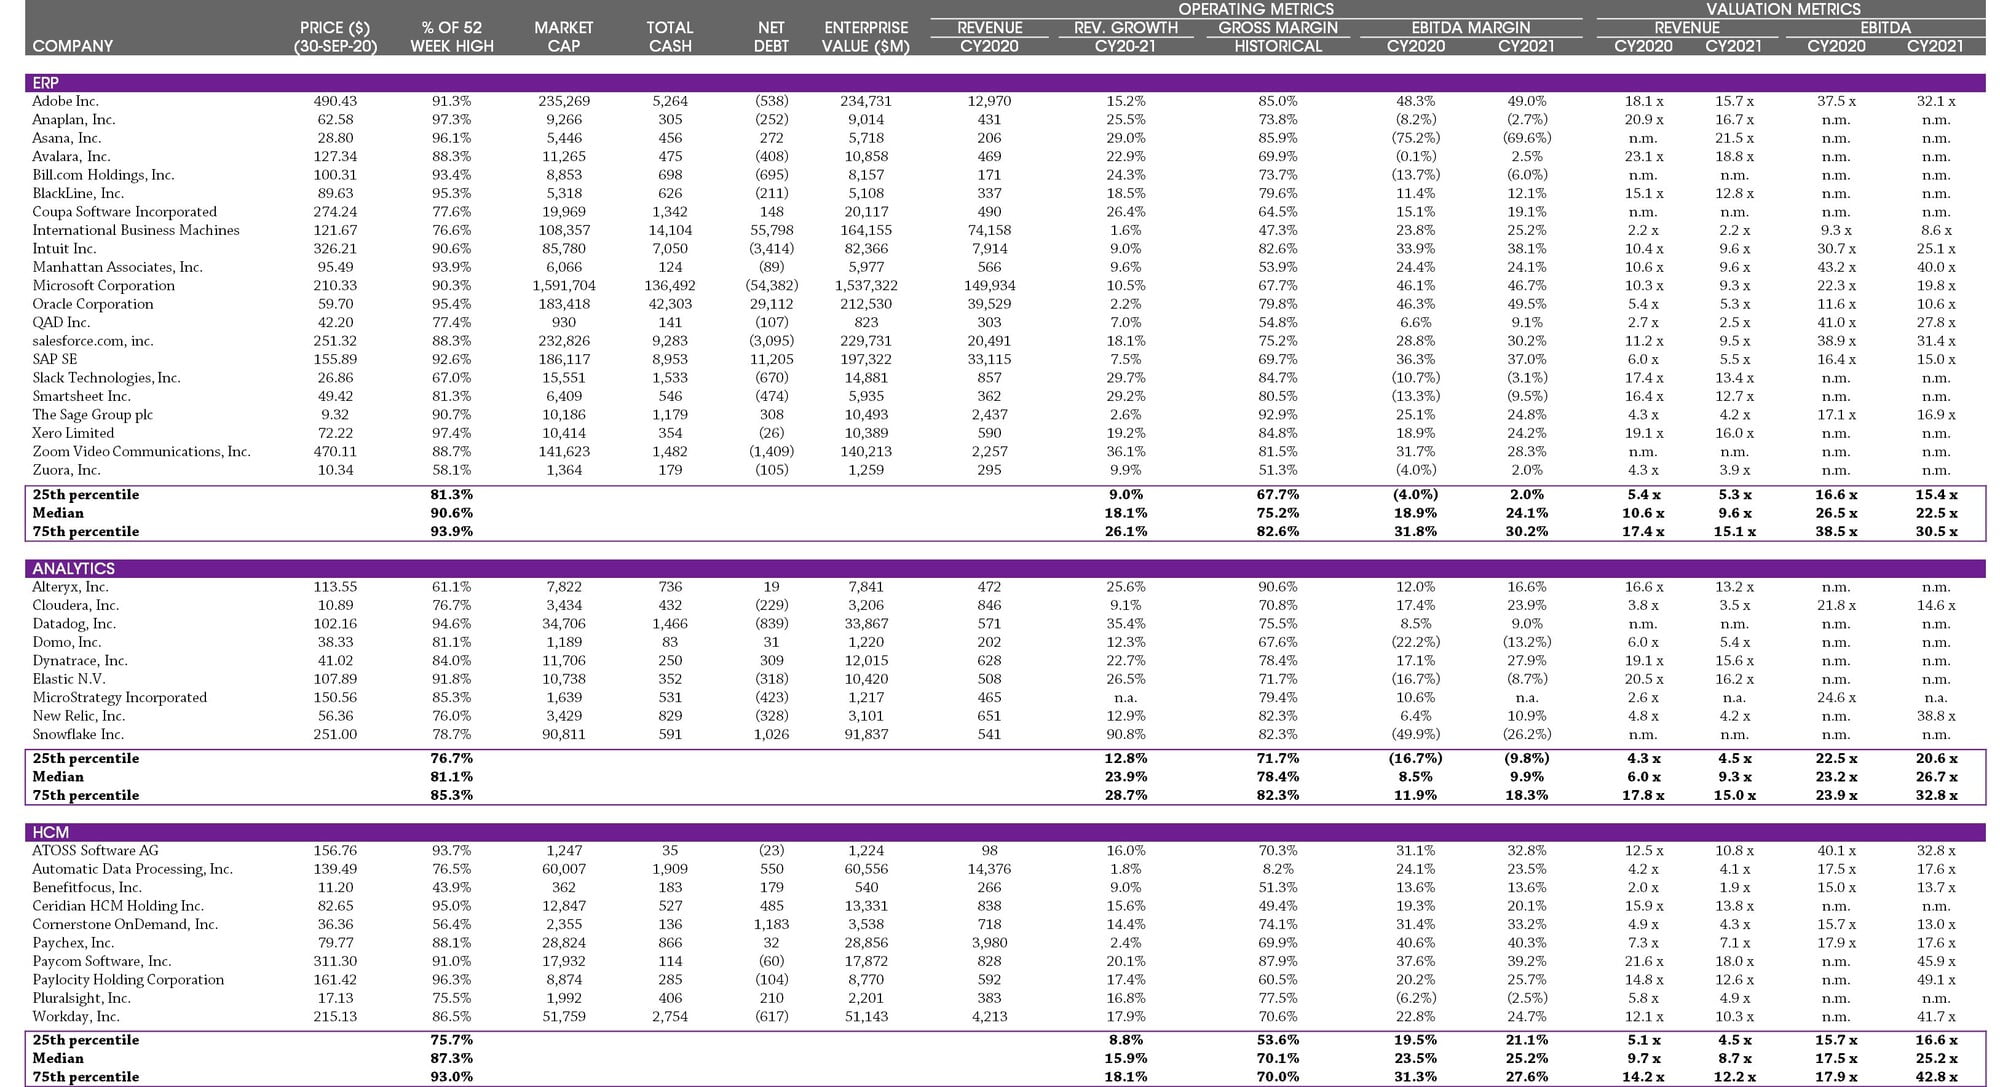
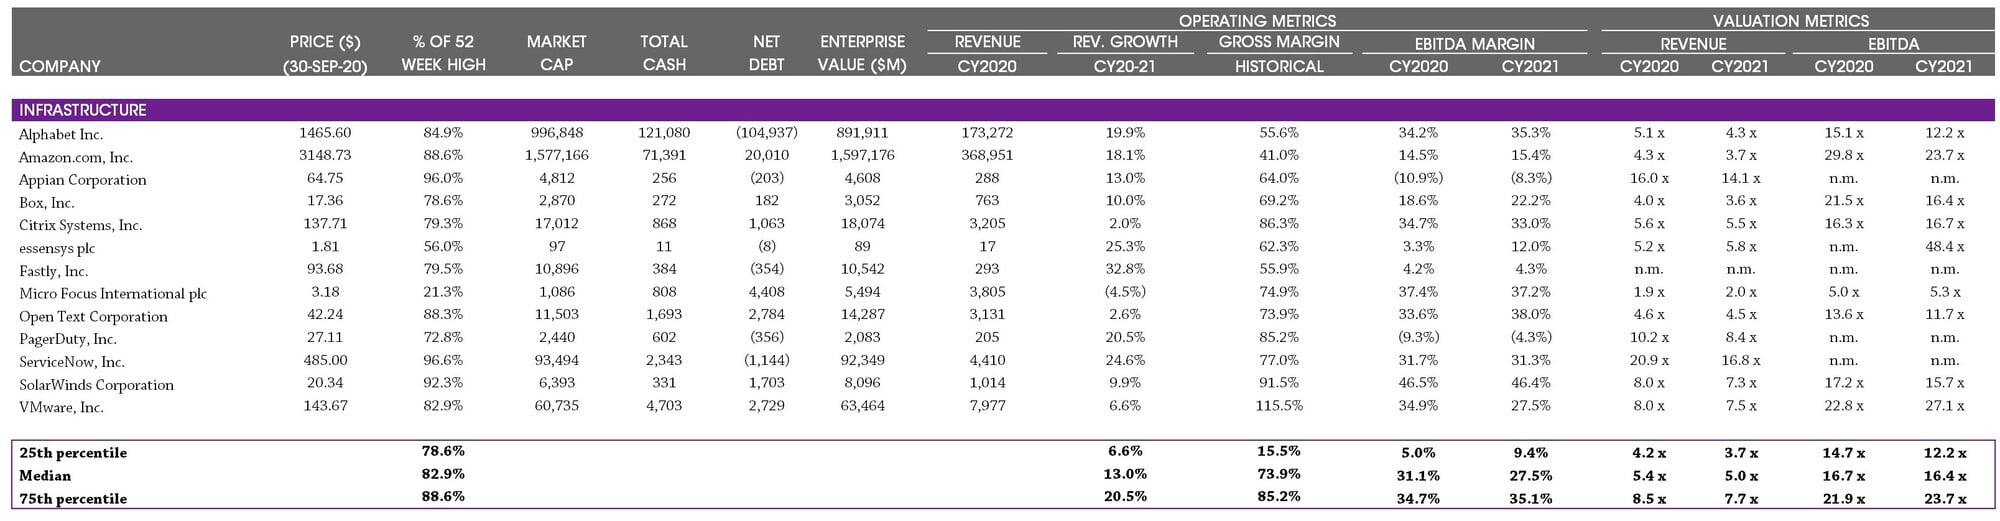
Note: Calendarised to December year end; $ millions, except share price data; multiples capped at 25x EV / Revenue and 50x EV / EBITDA; net debt includes minority interest. Source: Capital IQ.
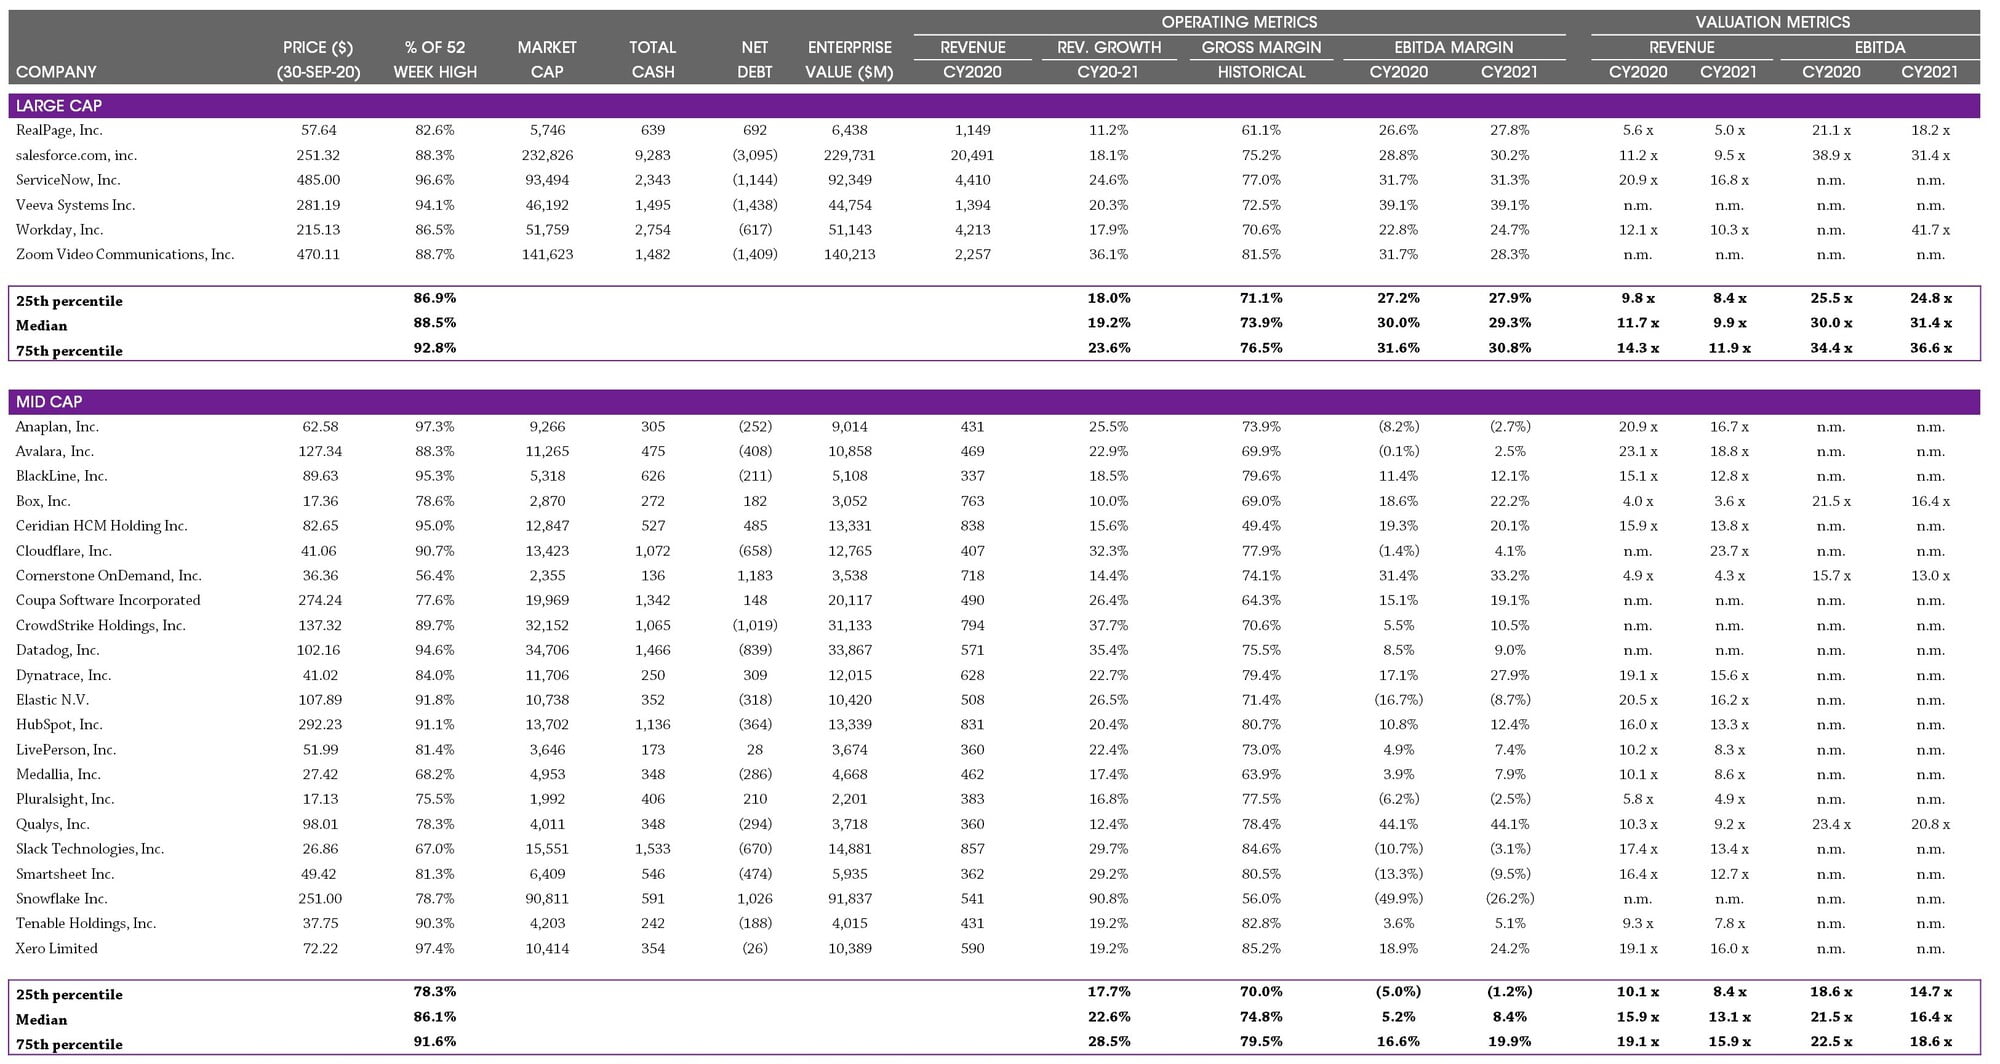
Note: Calendarised to December year end; $ millions, except share price data; multiples capped at 25x EV / Revenue and 50x EV / EBITDA; net debt includes minority interest. Note: Market cap classifications categorised by CY2020E revenue: Large Cap: revenues greater than $900m; Mid Cap: revenues between $350m and $900m; Small Cap: revenues less than $300m. Source: Capital IQ, broker reports.
Note: Calendarised to December year end; $ millions, except share price data; multiples capped at 25x EV / Revenue and 50x EV / EBITDA; net debt includes minority interest. Note: Market cap classifications categorised by CY2020E revenue: Large Cap: revenues greater than $900m; Mid Cap: revenues between $300m and $900m; Small Cap: revenues less than $300m. Source: Capital IQ, broker reports.