The enterprise software market review: Q3 2021
Welcome to the Q3 2021 edition of our Enterprise Stack Report – Results’ quarterly market update for the enterprise software sector
Contact: Julie Langley Contributors: Richard Latner, Albert Kouzminski, Vinay Saraiwala
Following a strong Q2, the path to recovery from the global pandemic is increasingly clear on account of re-opening economies, record-breaking stock markets and an abundant supply of cheap capital fueling investor appetite
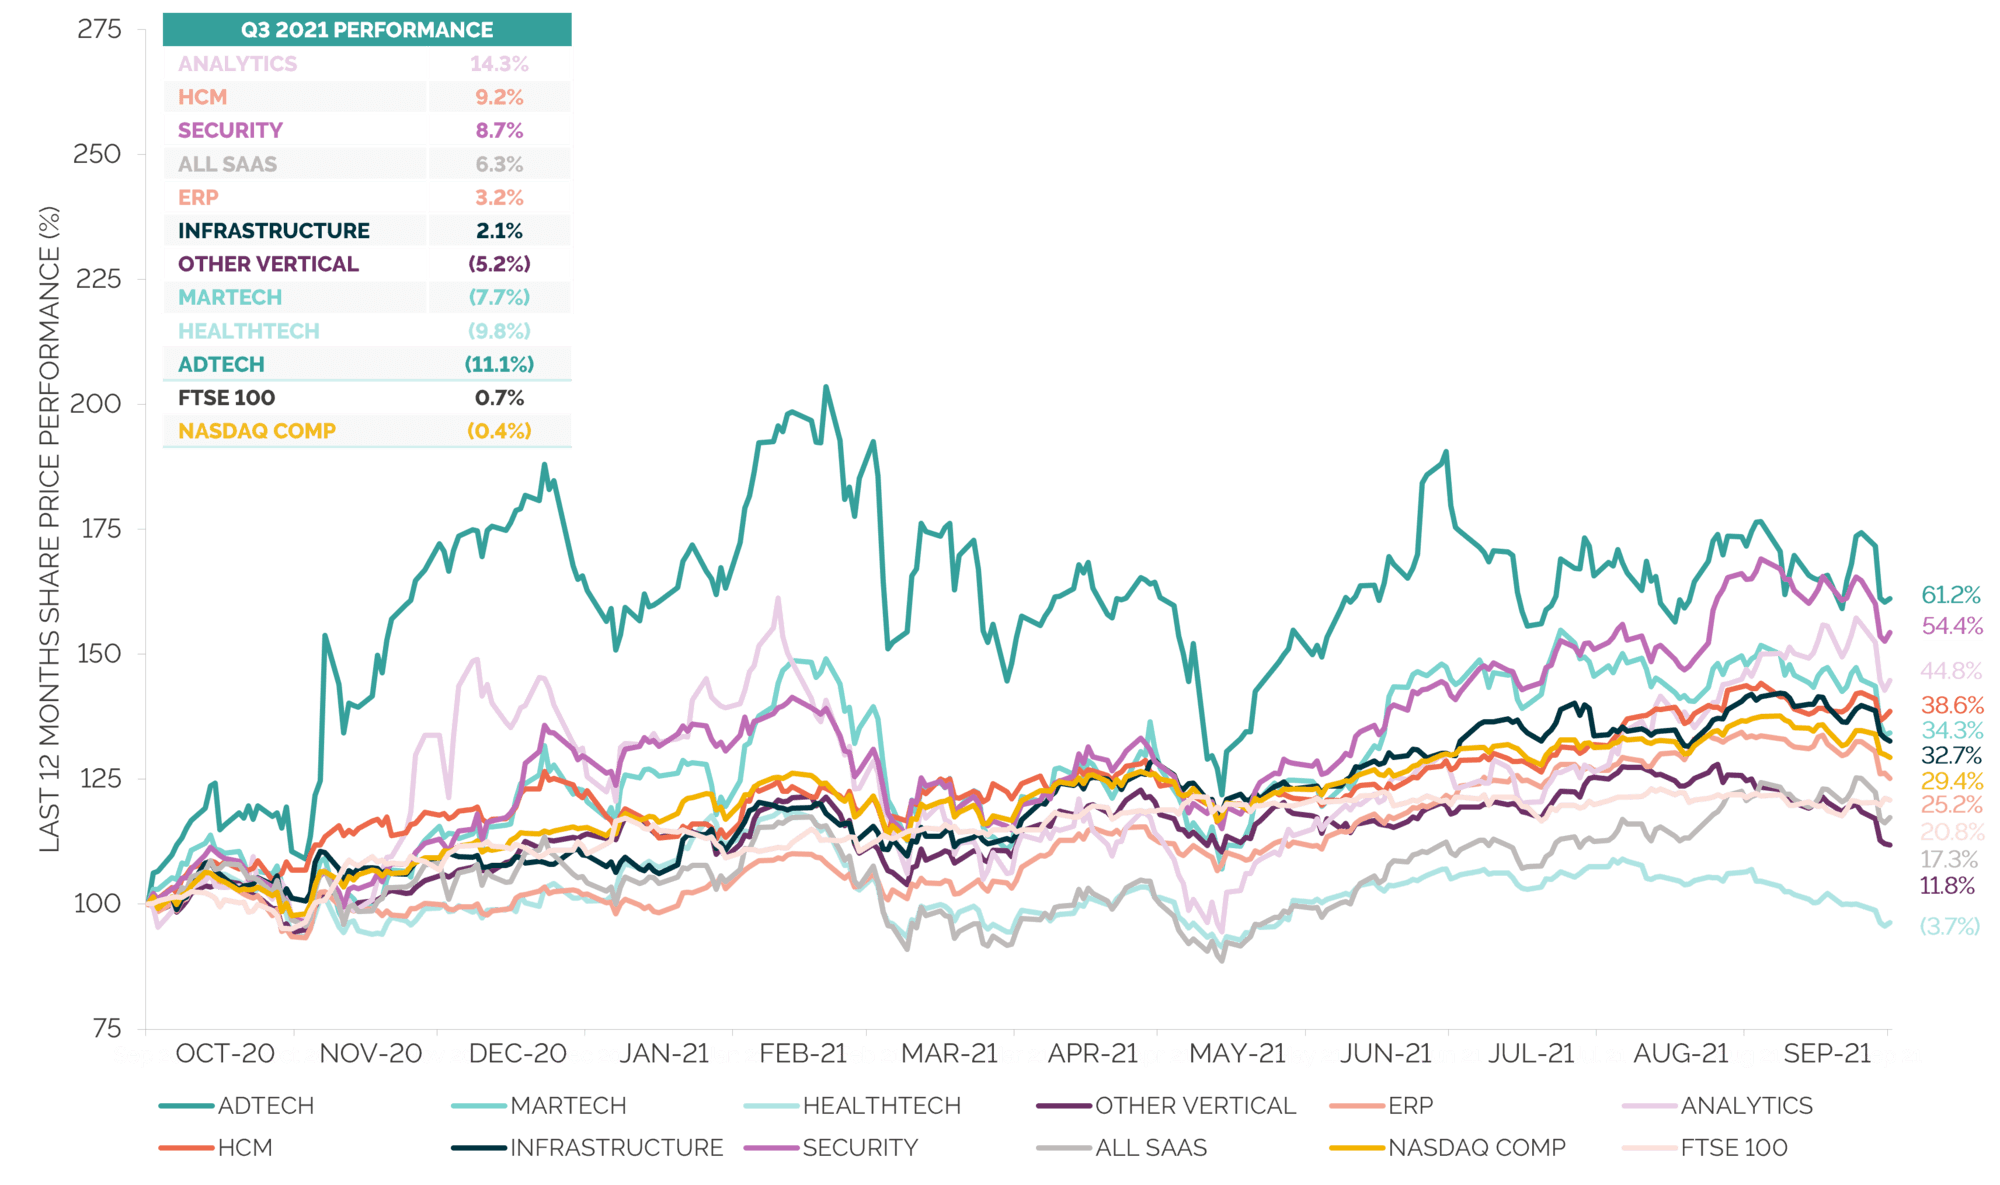
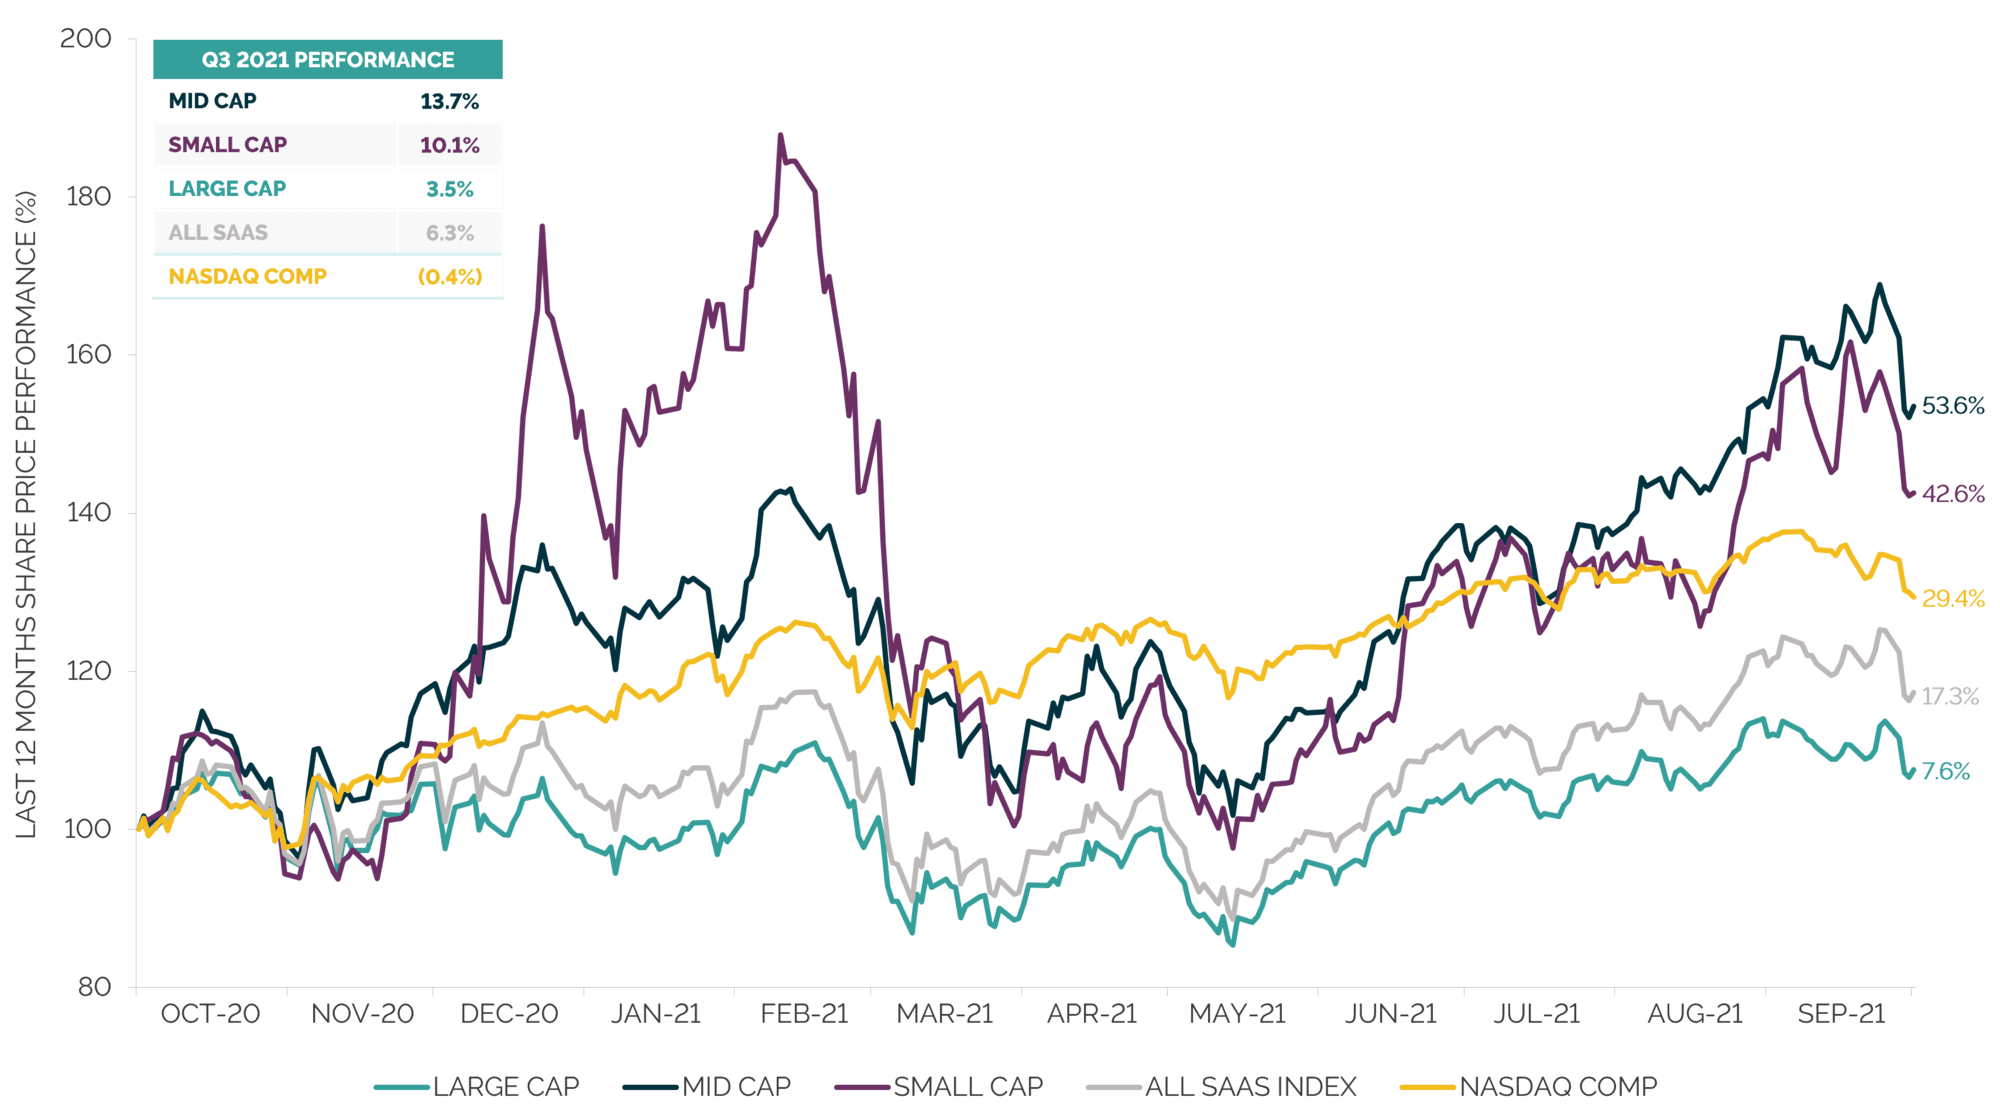
Our index of Pure Play SaaS vendors is up 6% in Q3, and this uplift is seen across some of the other indices we track, including Analytics (14%), HCM (9%) and Cybersecurity (c.9%); most of the indices have outperformed FTSE 100 on a last 12 months basis with share prices up 10-60% and NASDAQ up 29% on September 2020
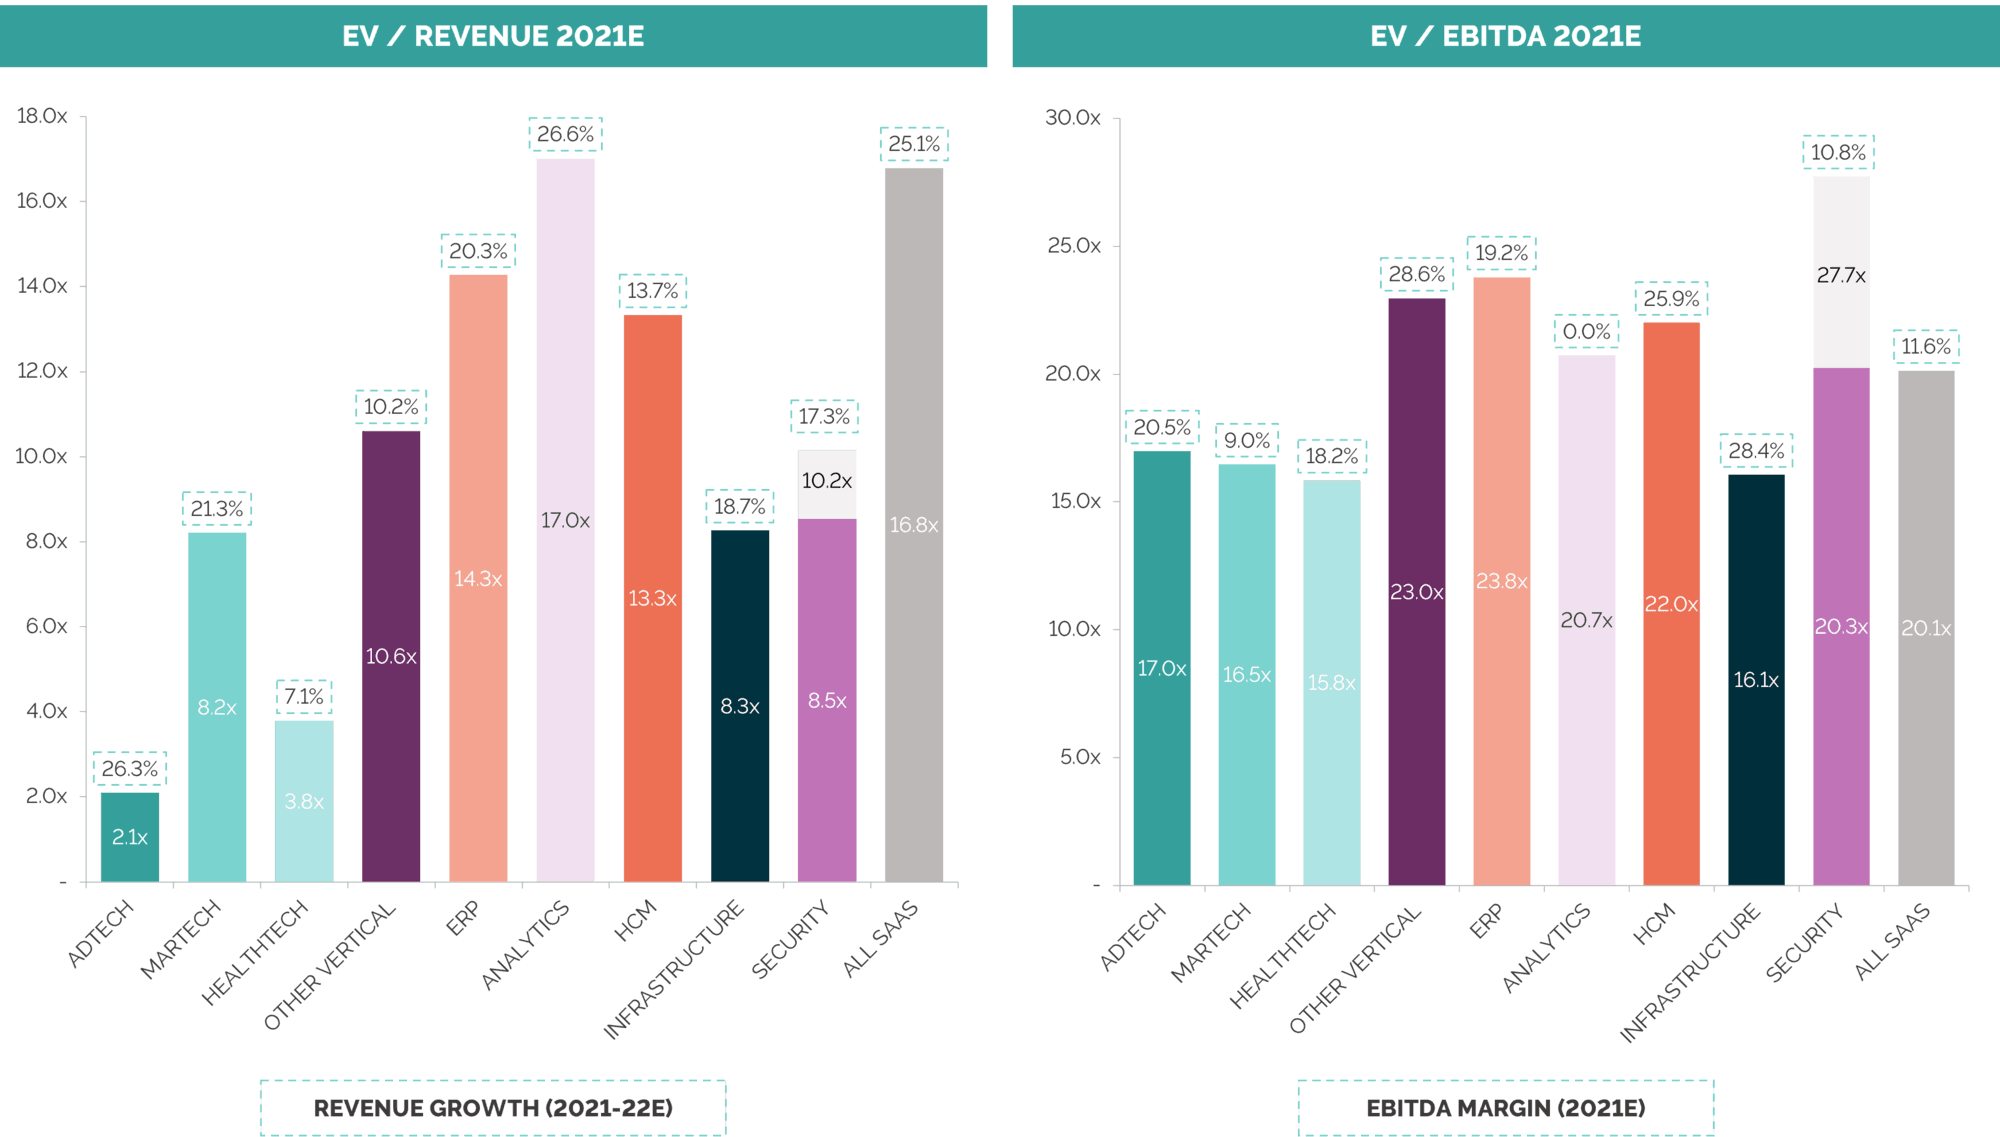
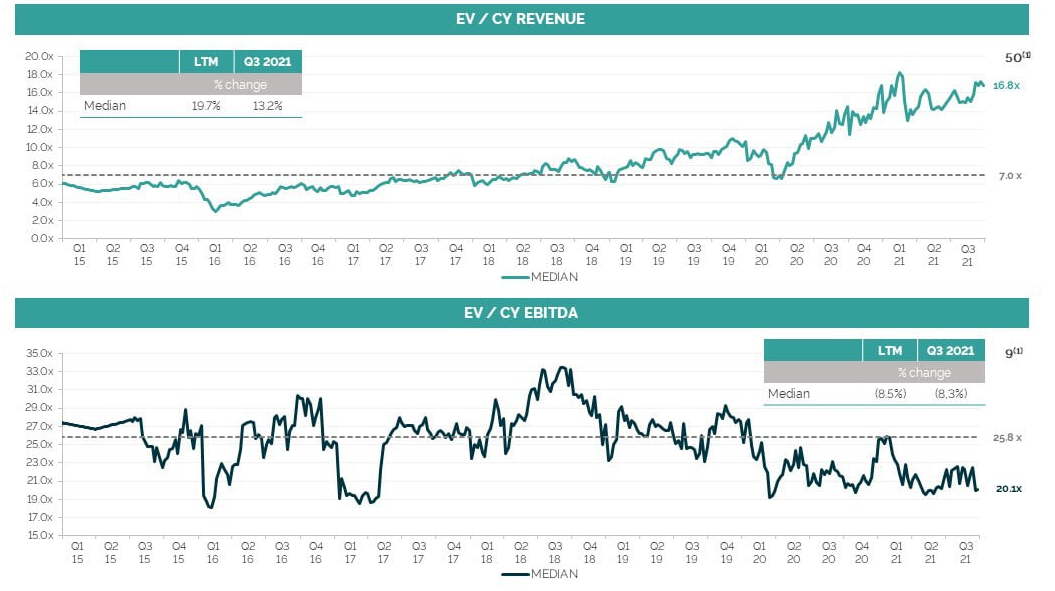
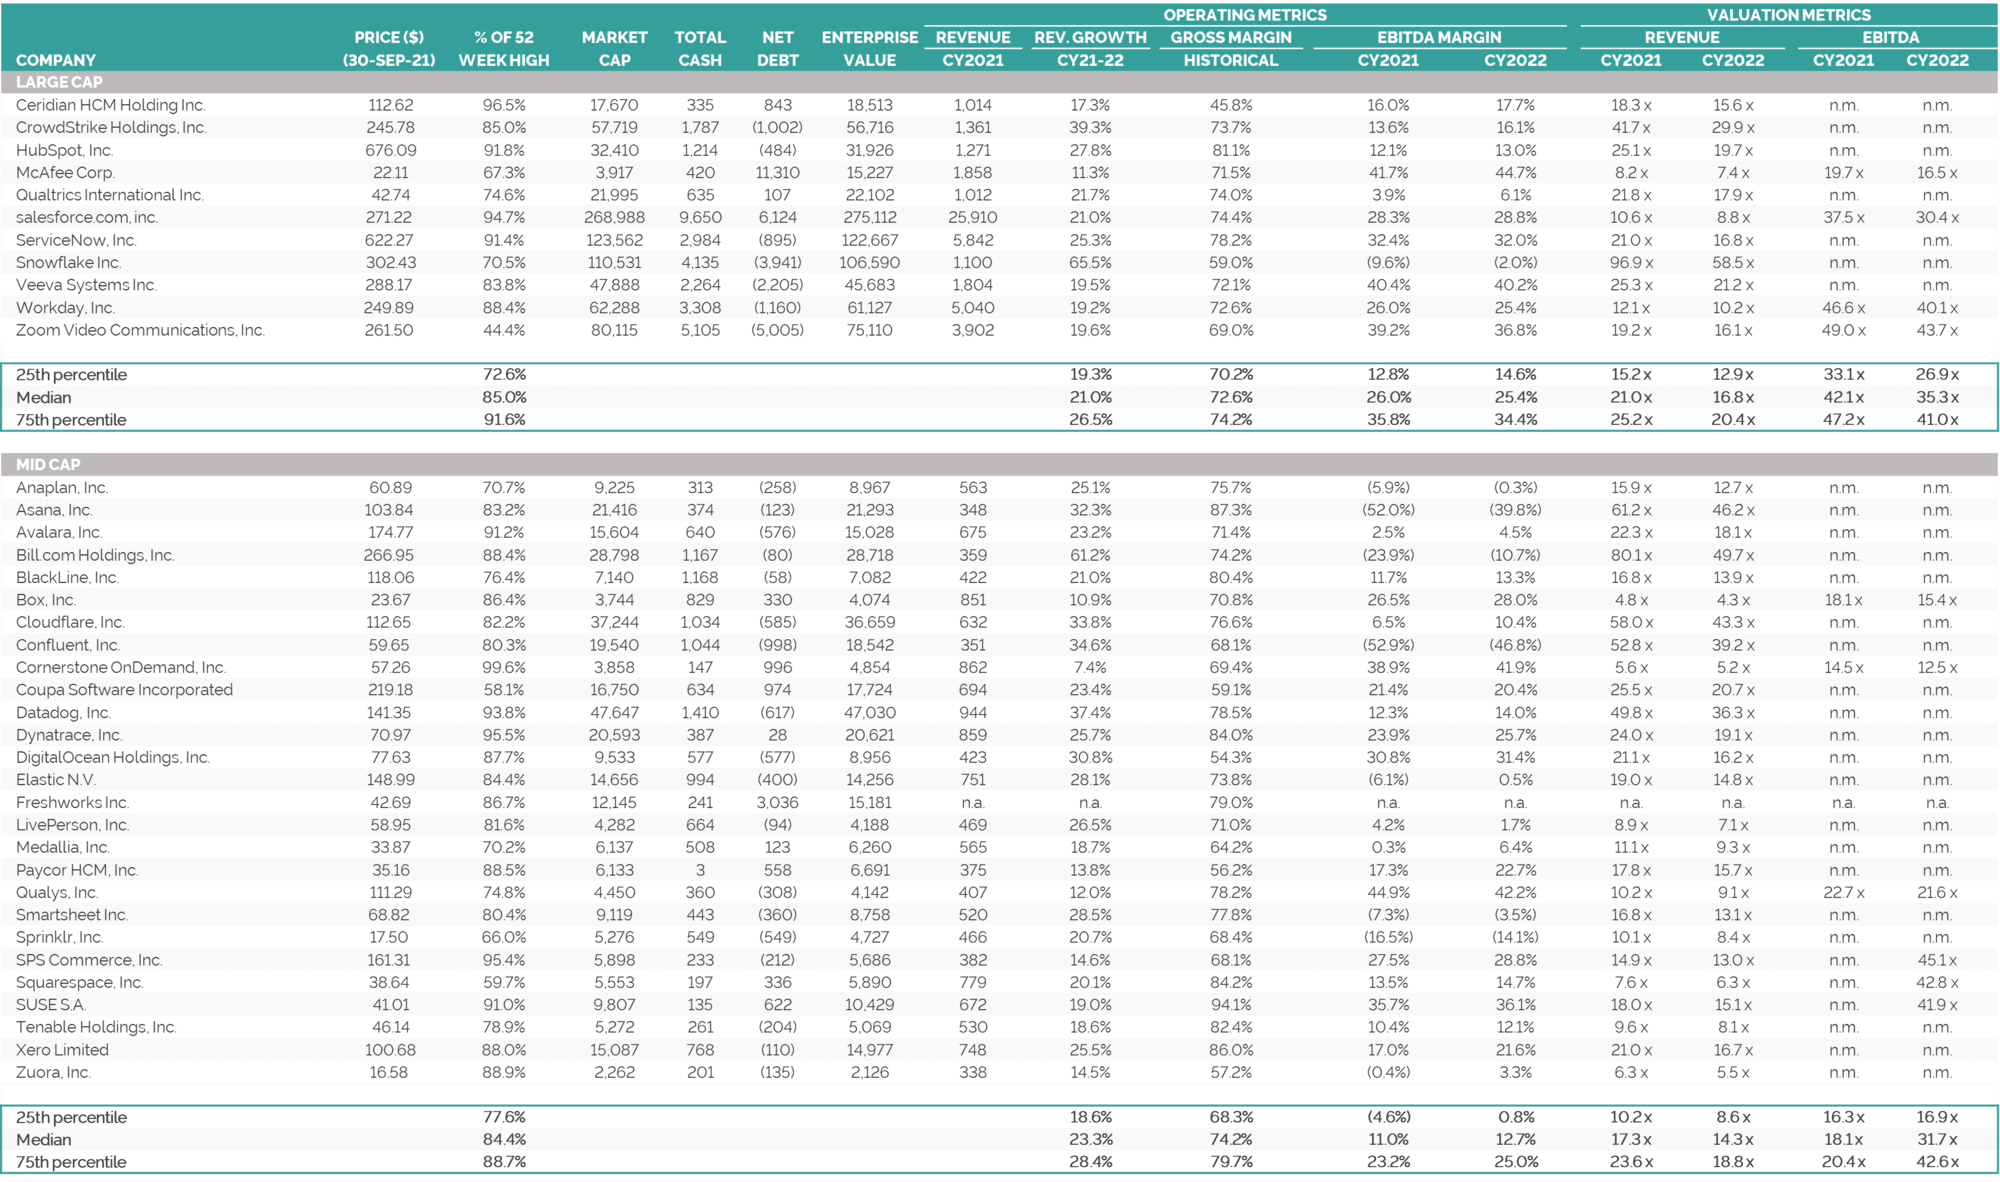
Valuation multiples are also consistently strong this quarter with SaaS businesses trading at a median of 16.8x revenue and 20.1x EBITDA in Q3 2021, compared to 15.6x revenue and 21.5x EBITDA in Q2 2021
Publicly traded software companies’ stocks are trading at record highs, resulting in several IPOs in Q3, with 13 across the sectors we track, including three in ERP (EngageSmart, Freshworks and Kaltura), two in Cybersecurity (ForgeRock and Exclusive Networks), two in Infrastructure (AvePoint and Couchbase) and others in Adtech, Healthtech, Analytics, HCM and Other Vertical (Outbrain, Definitive Healthcare, Clearwater Analytics, Amplitude, Paycor and Toast)
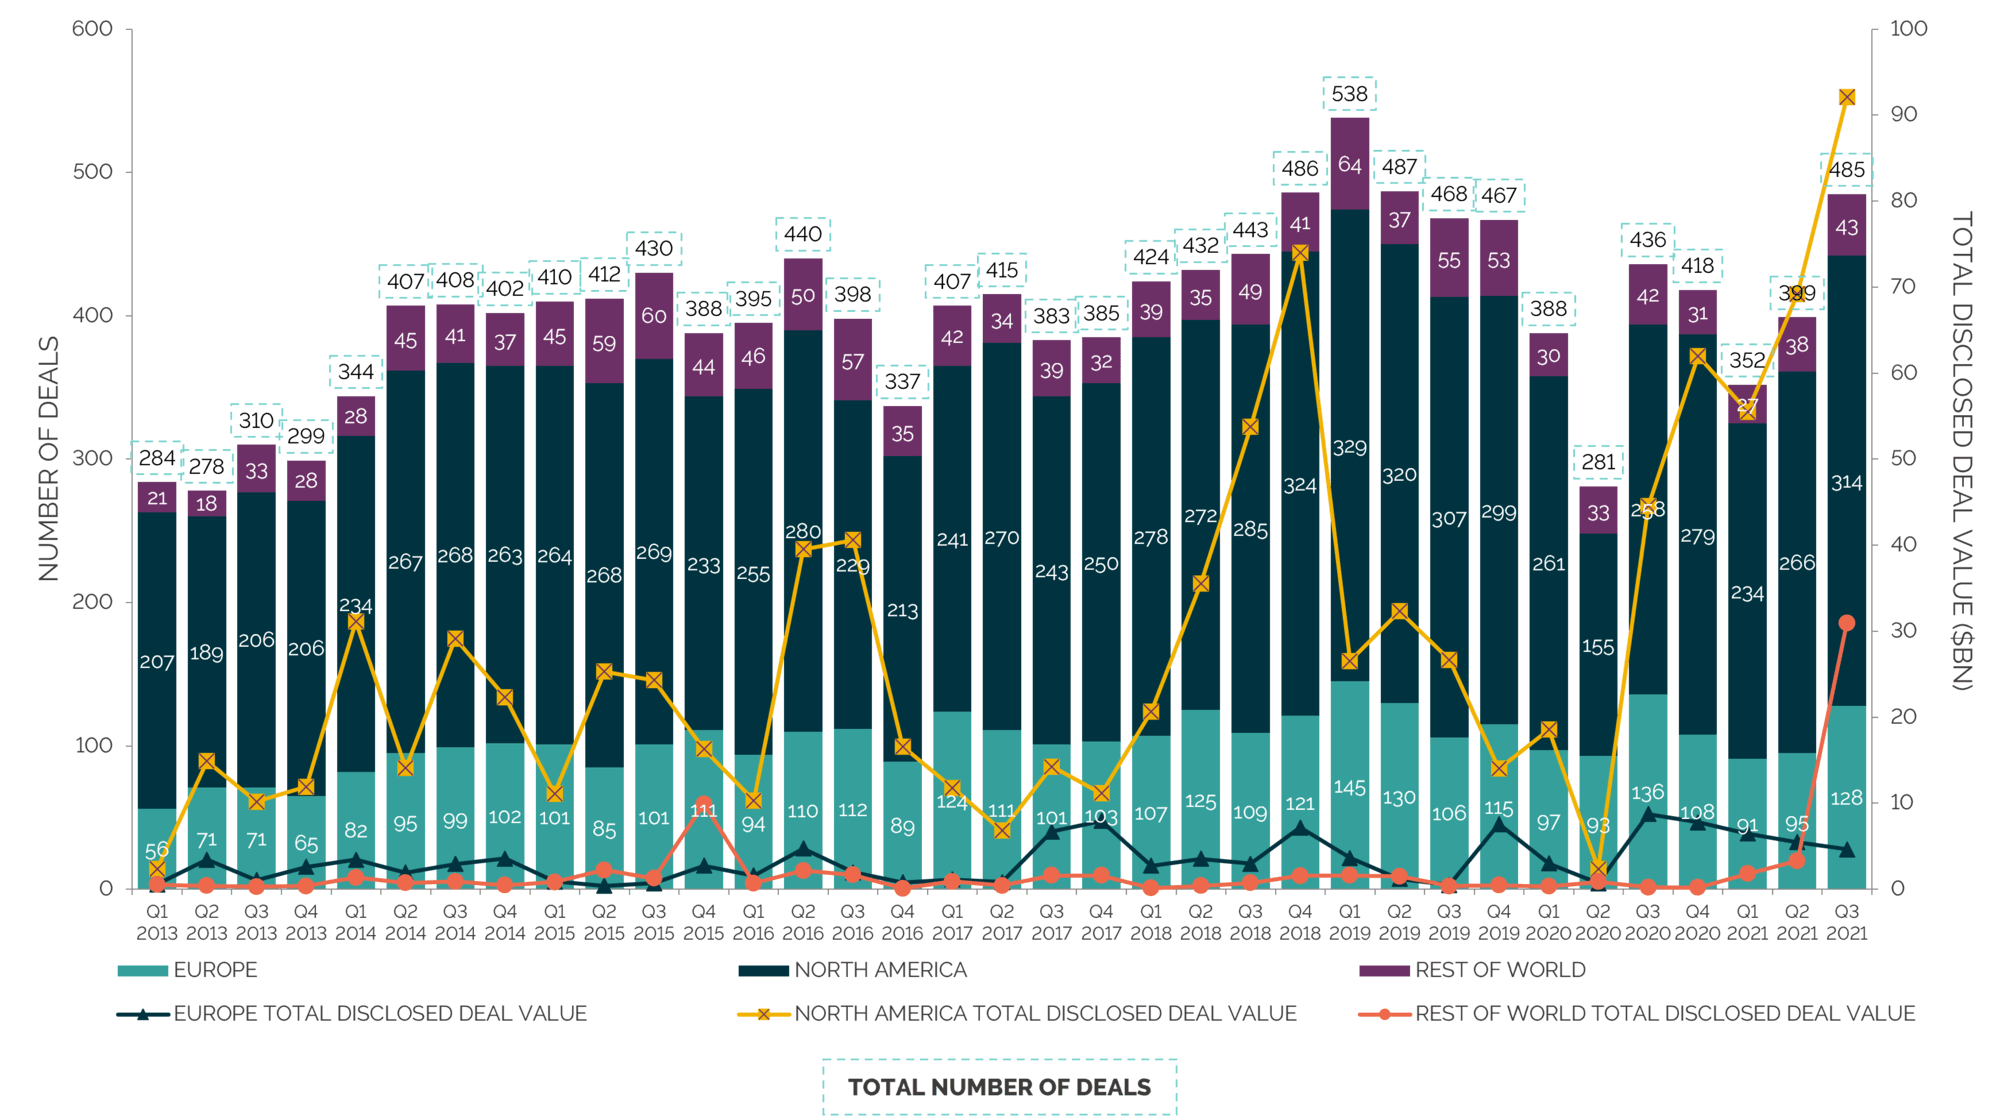
Technology accounts for 27% of global deal value so far in 2021 – its largest ever share, followed by Healthcare with 10.5% of the total deal value
Like the last two quarters, deal making surged in Q3 with volumes up more than 20% on Q2 2021. The quarter witnessed c.500 transactions to further accelerate the adoption of technology in the wake of Covid-19
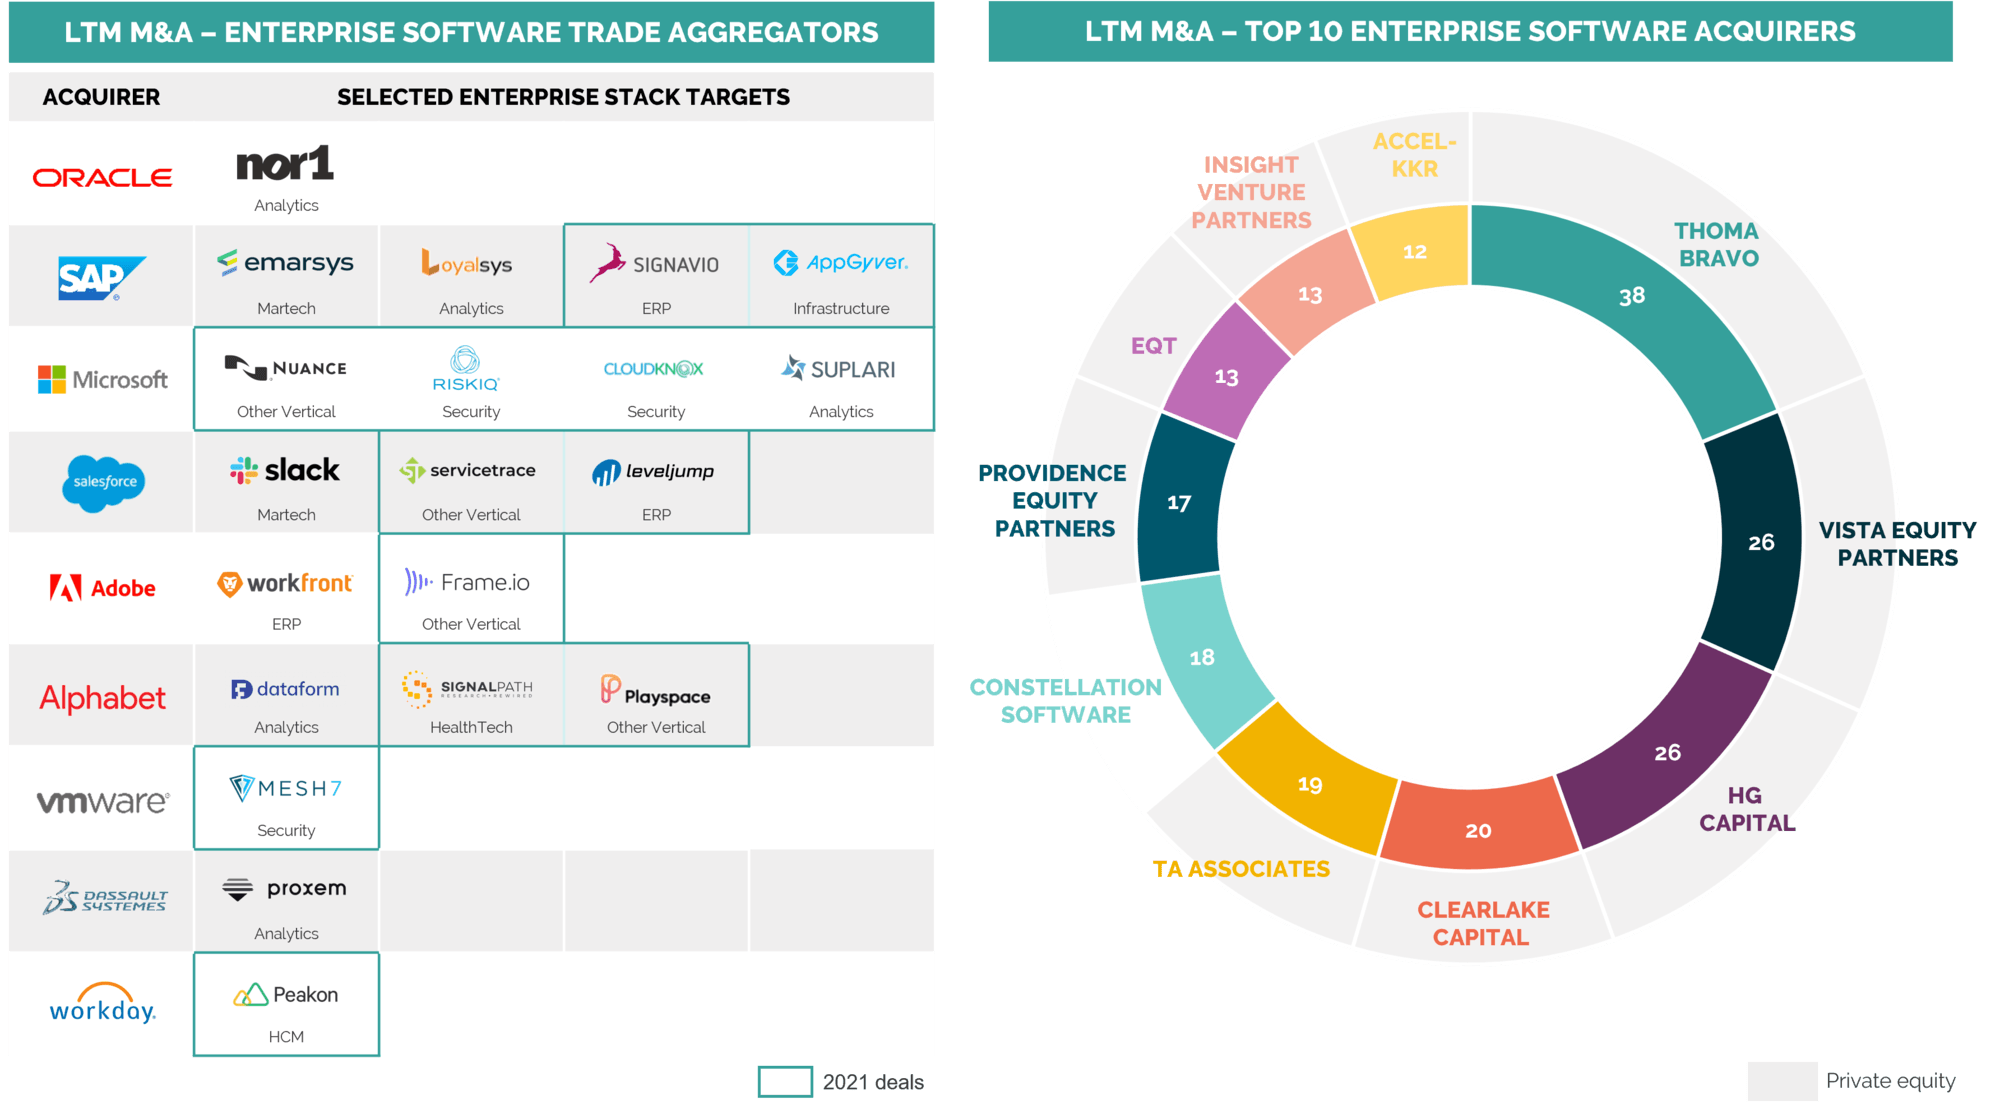
As has been the case for many quarters, private equity continues to dominate with Constellation Software being the only strategic to feature in our top 10 most acquisitive buyers in the last 12 months
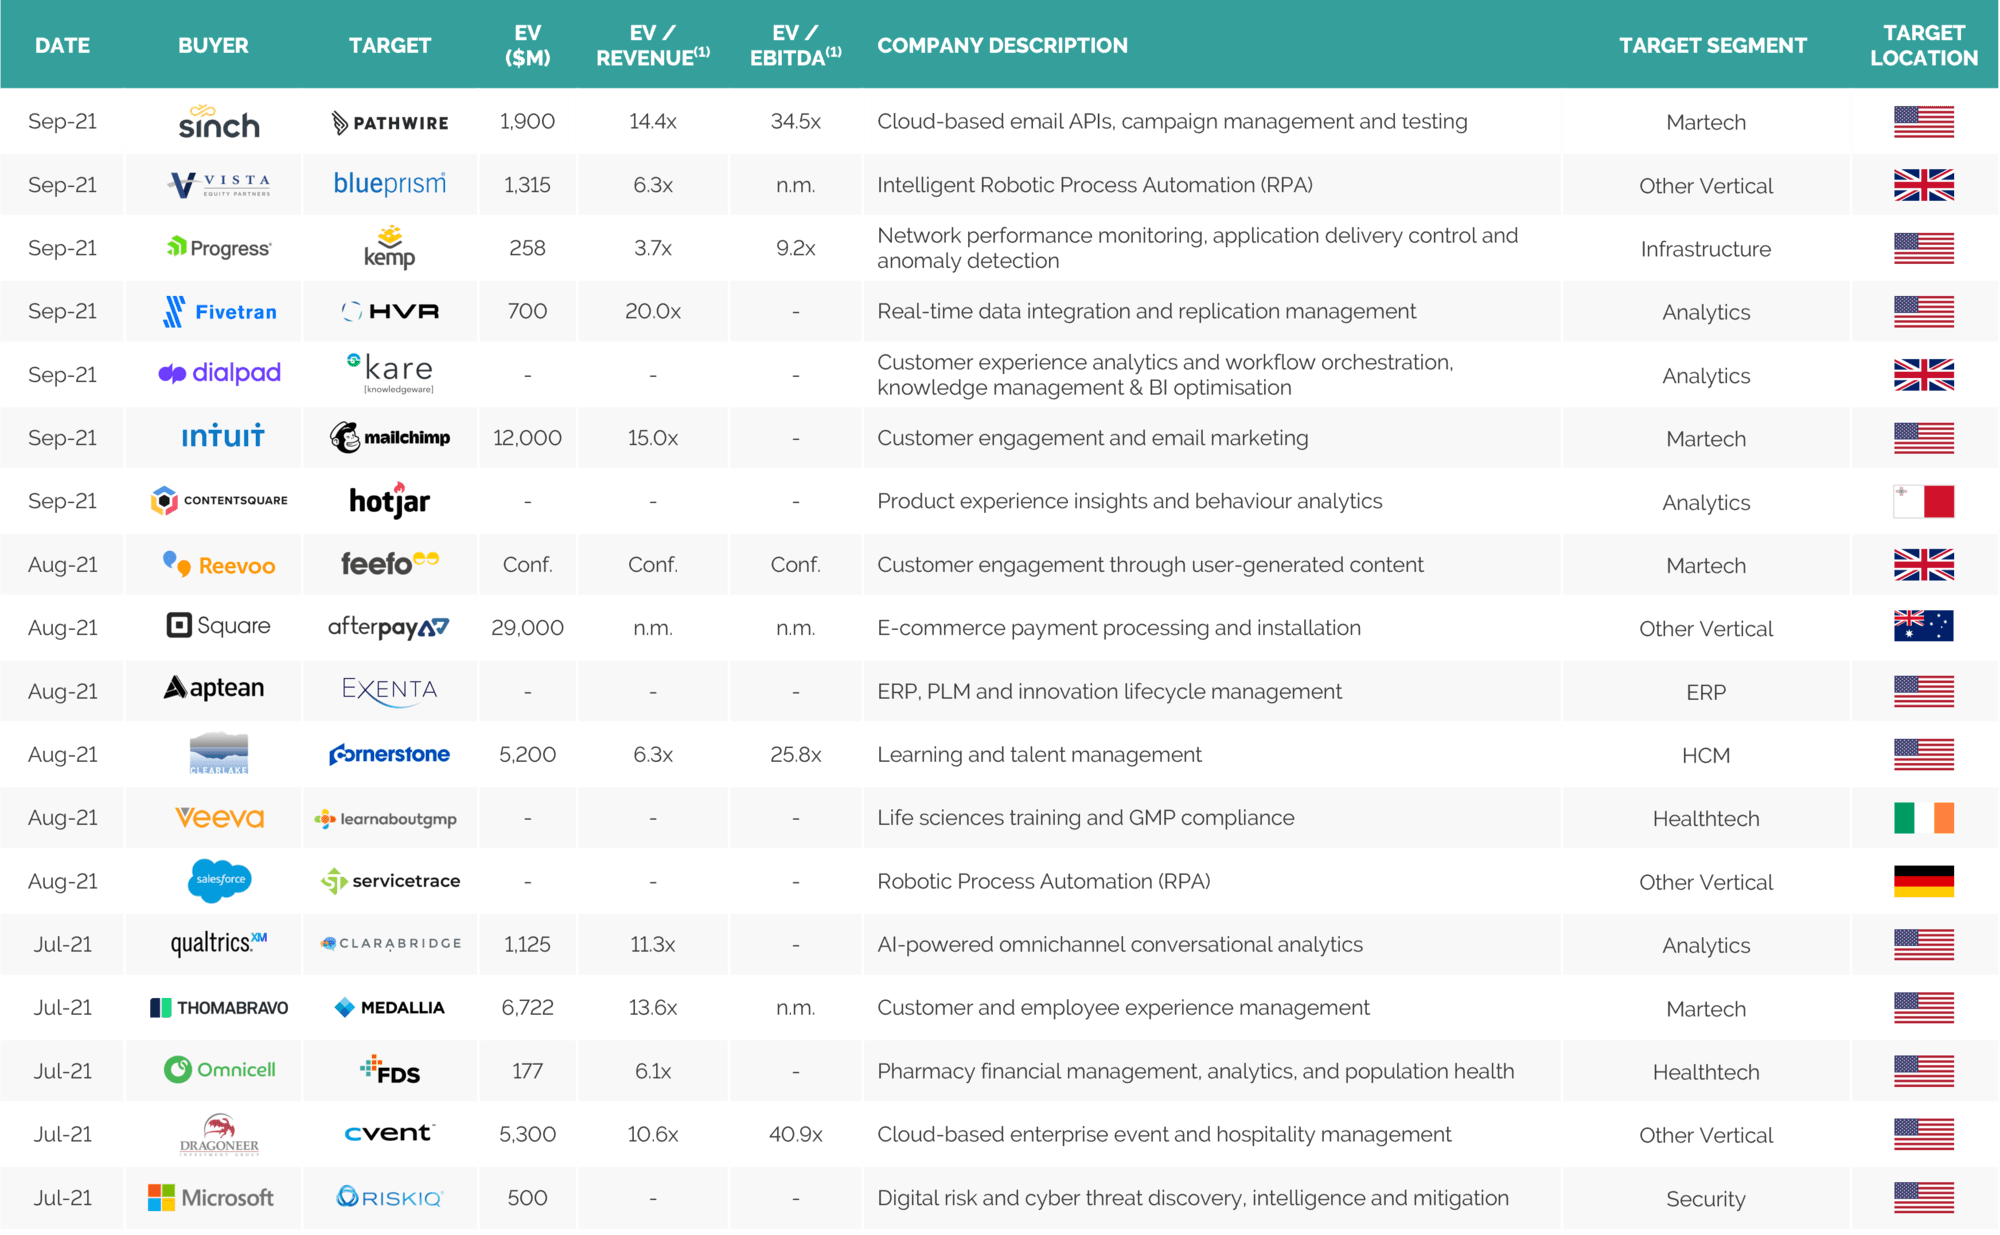
Premium SaaS businesses with strong growth and underlying metrics are fetching premium valuations globally with several sizeable deals in Q3 including Square’s $29Bn takeover of Australia-based Afterpay (e-commerce payment processing and installation), Intuit’s $12Bn dollar purchase of Mailchimp (customer engagement and email marketing) and Thoma Bravo taking Medallia (customer and employee experience management) private in a $6.7Bn acquisition roughly two years after it went public
Automation and the recognition of its importance to drive speed and scale across the enterprise was also reflected in two notable European transactions in the quarter, with interest from both PE and trade; Vista Equity Partners sealed a $1.5Bn deal for Blue Prism (c. 6.3x revenue), while Salesforce entered the space with its acquisition of Servicetrace for an undisclosed amount
*Natural Language Processing
Notes: Based on share prices as at 30th September 2021; indices weighted by market capitalisation. Sources: Capital IQ and Results analysis
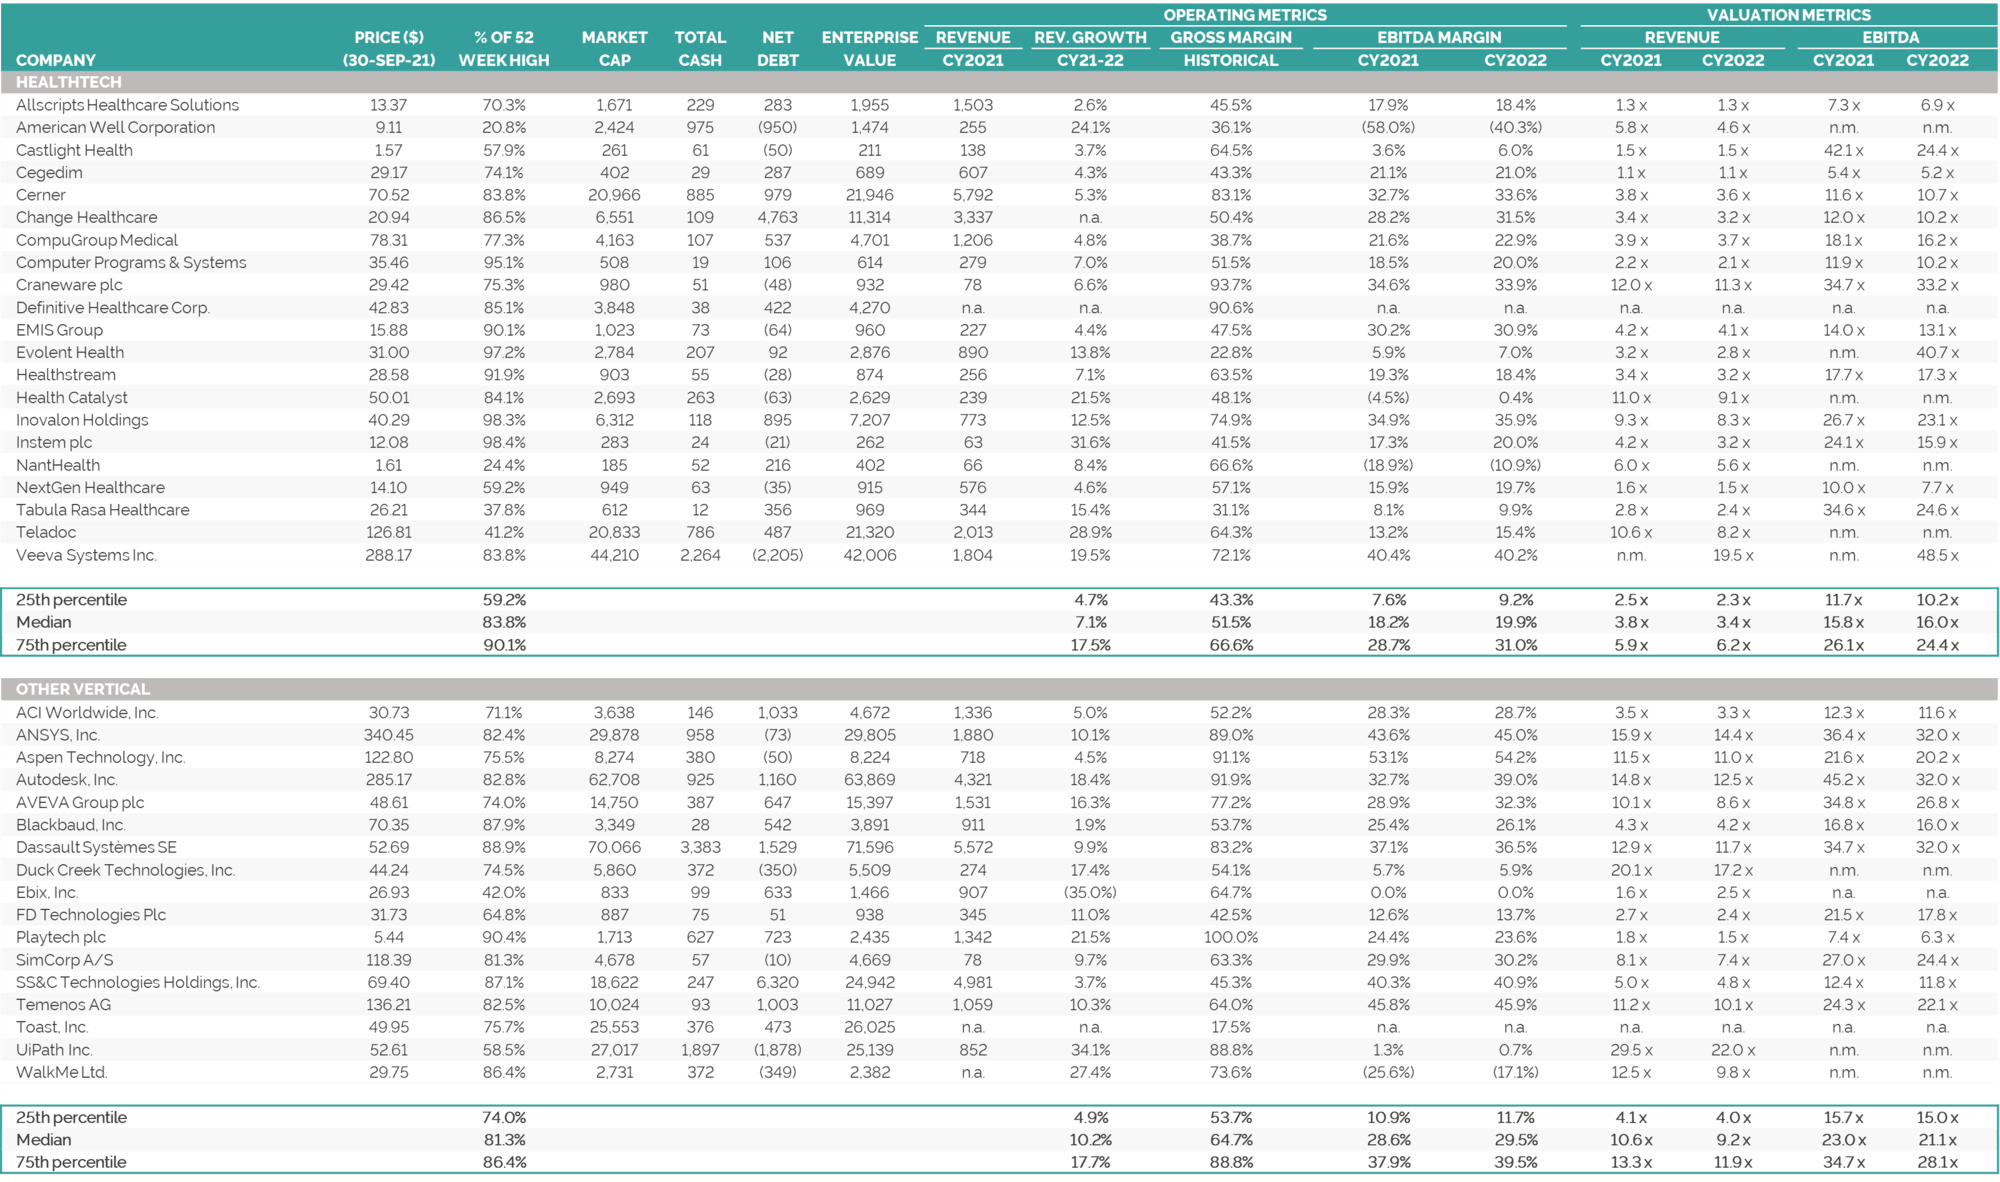
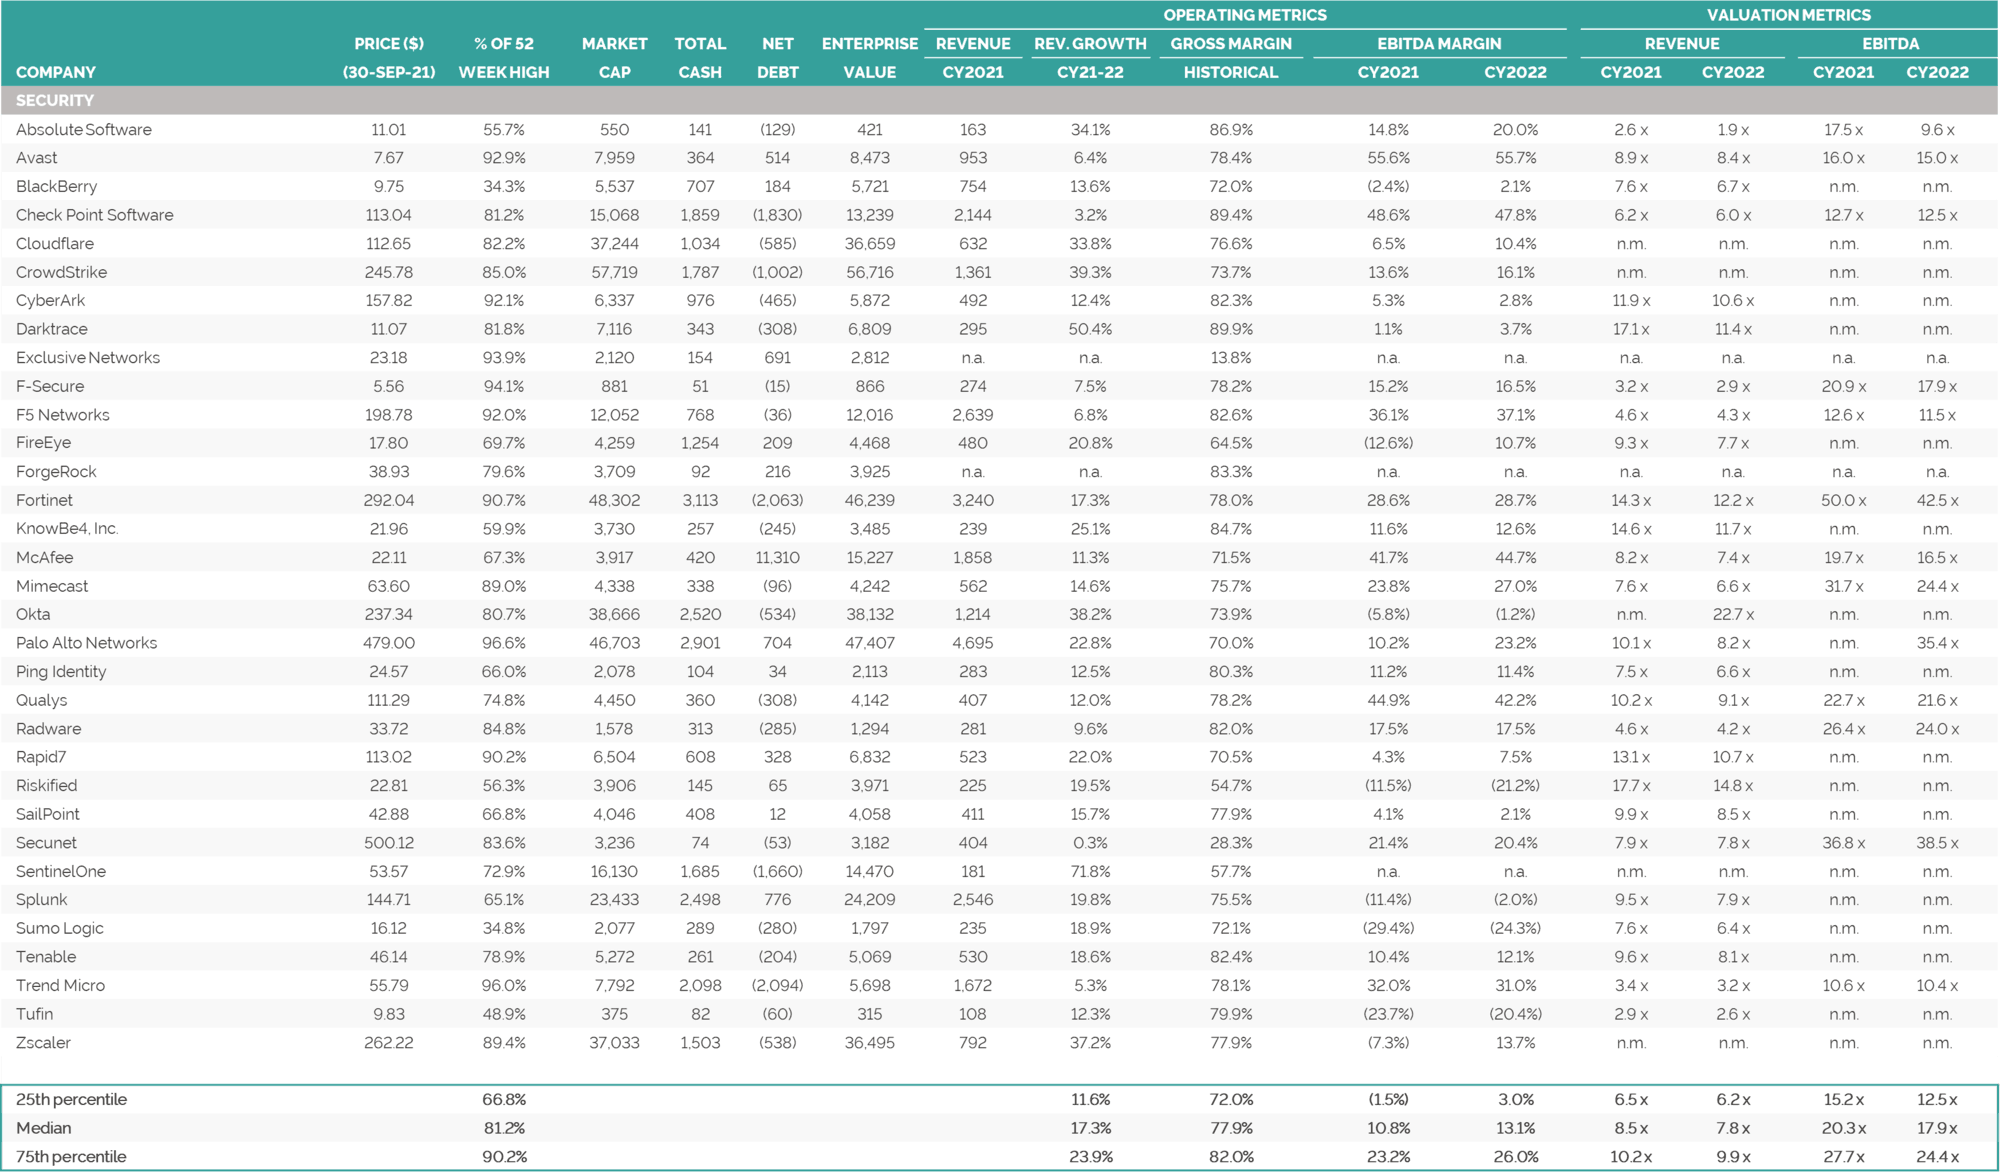
Note: For Security, 75th percentile values have been overlaid (shaded lighter) to illustrate next-generation vendors. Note: EV = Enterprise Value; financials calendarised to December year end; median values reported. See Selected Publicly Traded Companies (click here) for details of companies included in each category. Source: Capital IQ
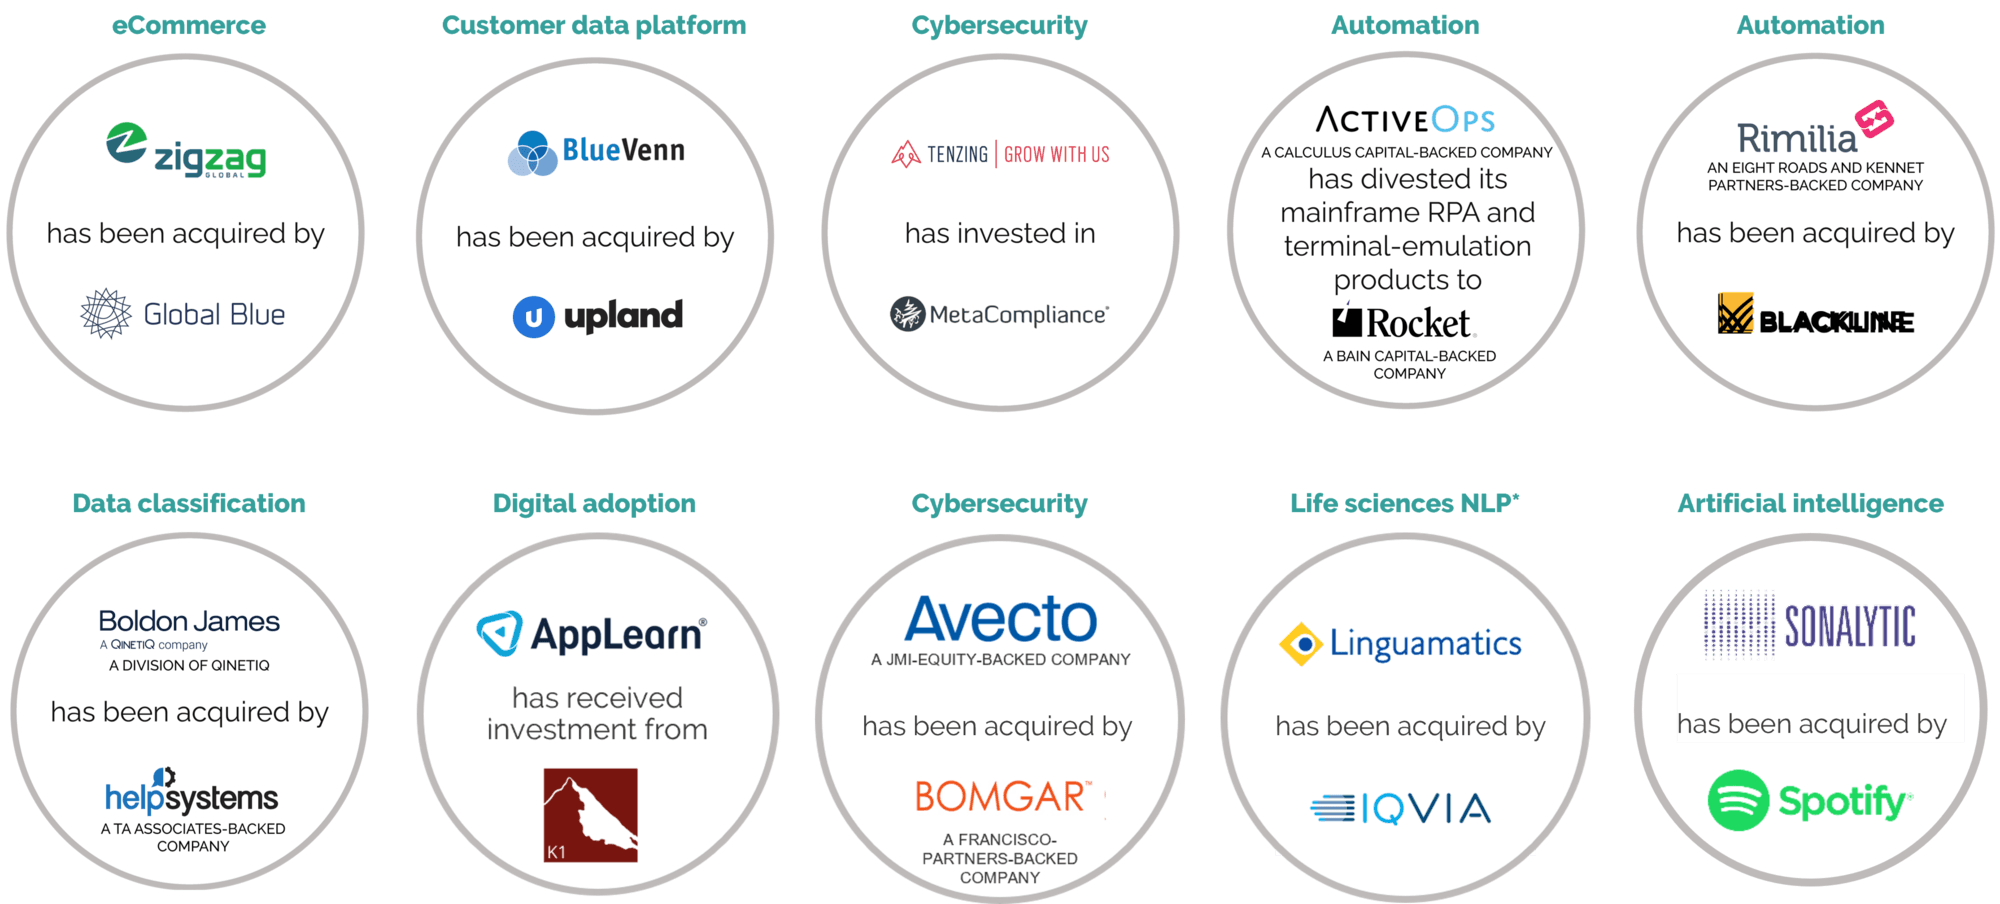
Sources: Press releases, Capital IQ, Mergermarket, 451 Research and Results analysis
Note: PE shown as acquirer when acquisitions made through portfolio company; parent shown as acquirer when acquisition made through group subsidiary / group. Sources: Press releases, Capital IQ, Mergermarket, 451 Research and Results analysis
1) In certain cases EV/Revenue and EV/EBITDA are publicly reported estimates; TTM financials have been used where possible; EV = transaction value scaled to 100% shareholding plus net debt (incl. minority interest). Note: Earnout considerations excluded in the calculation of Enterprise Value. Sources: Press releases, 451 Research and Results analysis
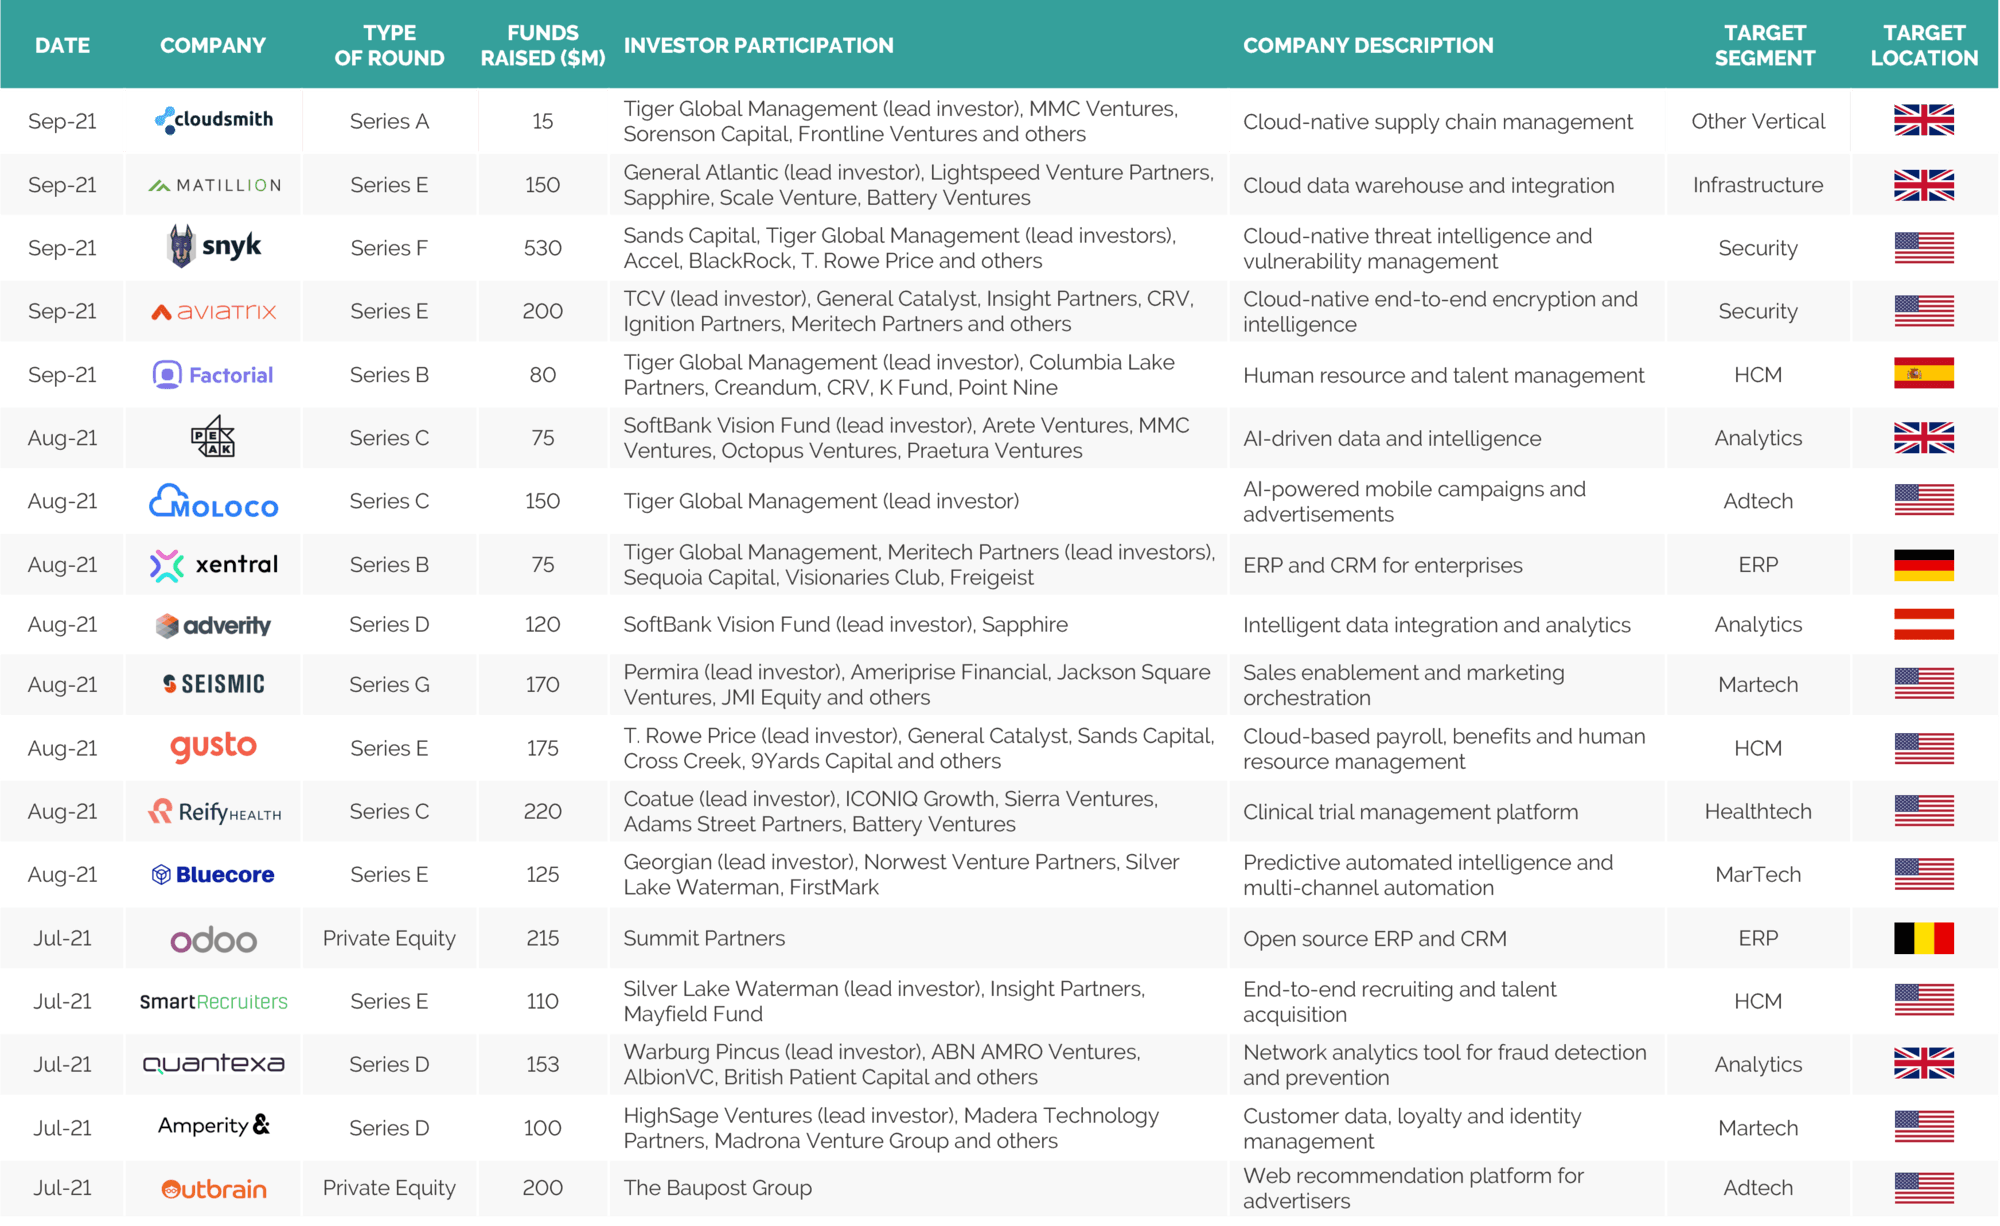
Sources: Pitchbook, Press releases, Crunchbase and Results analysis
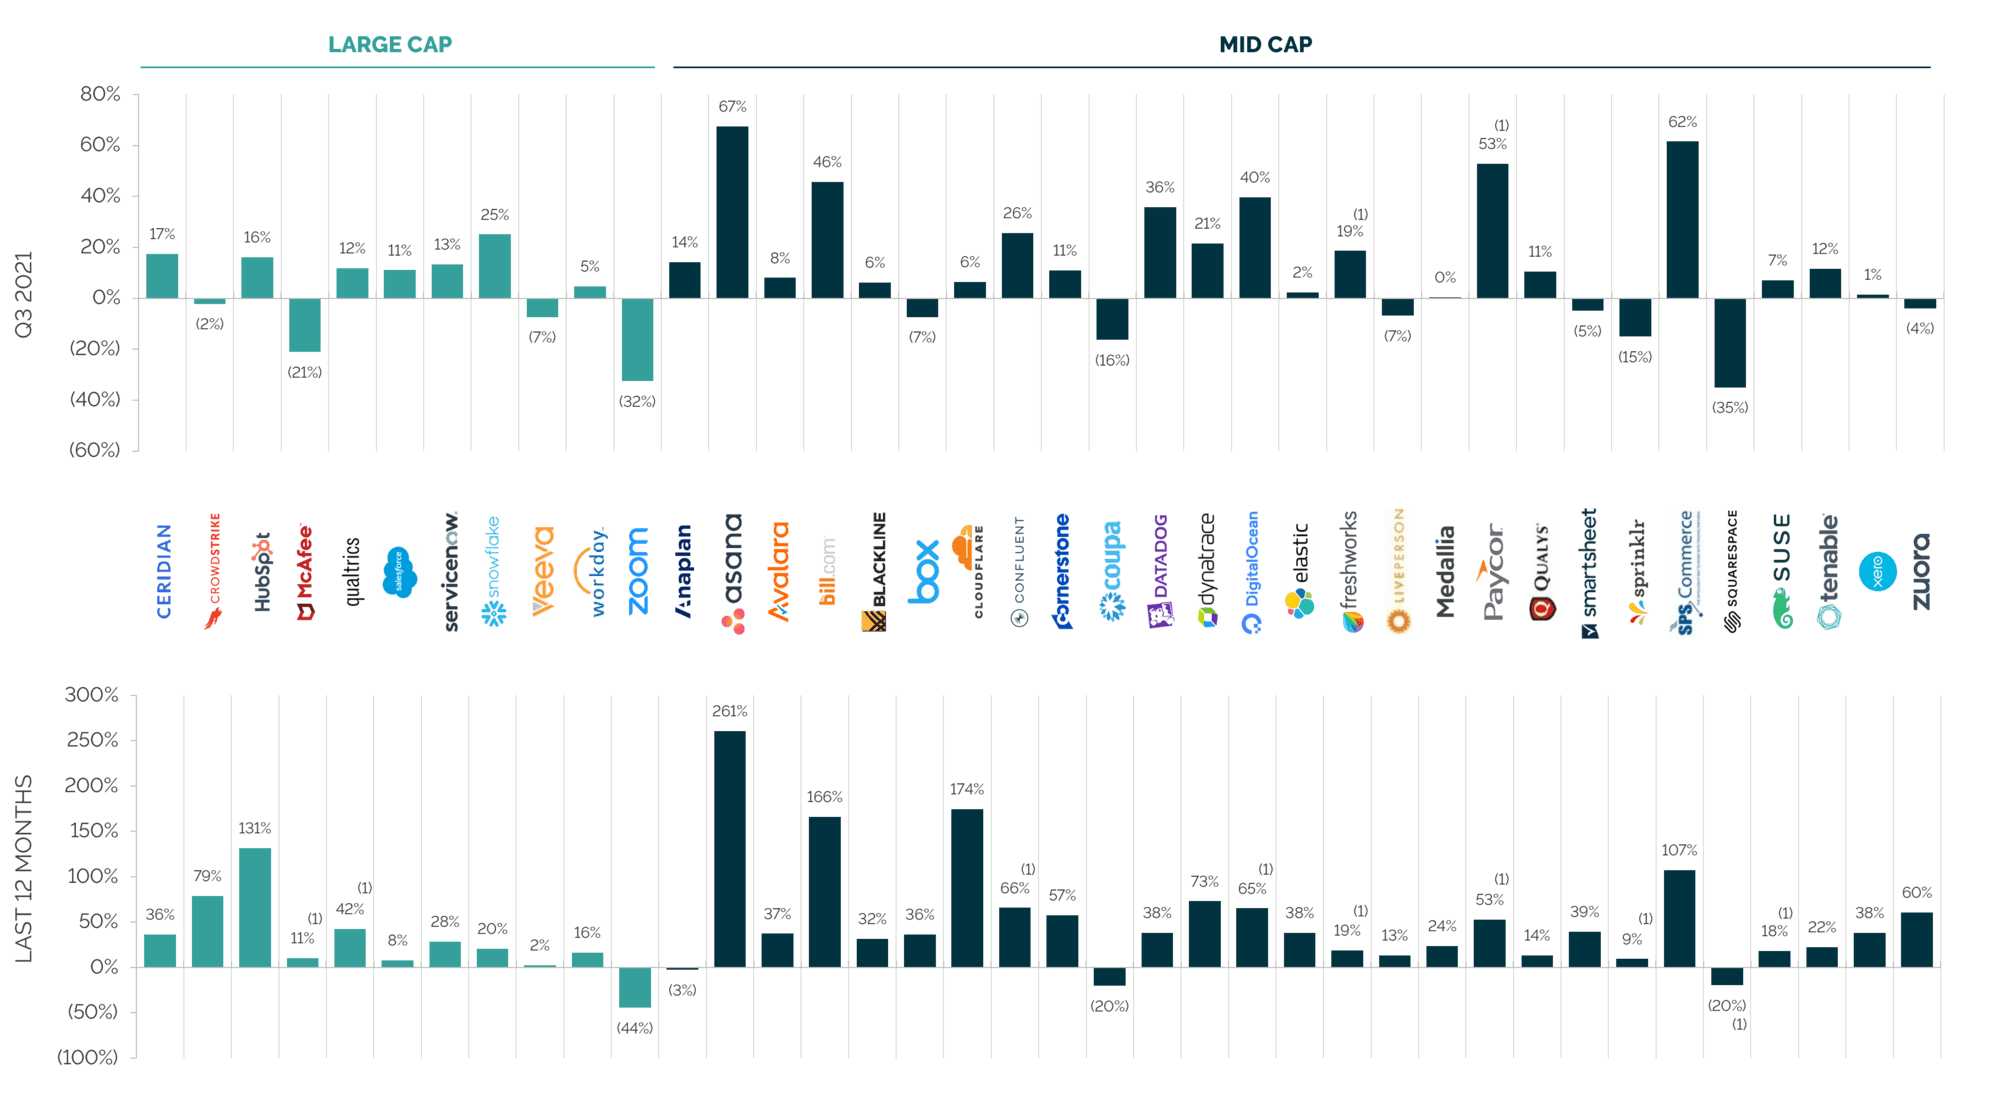
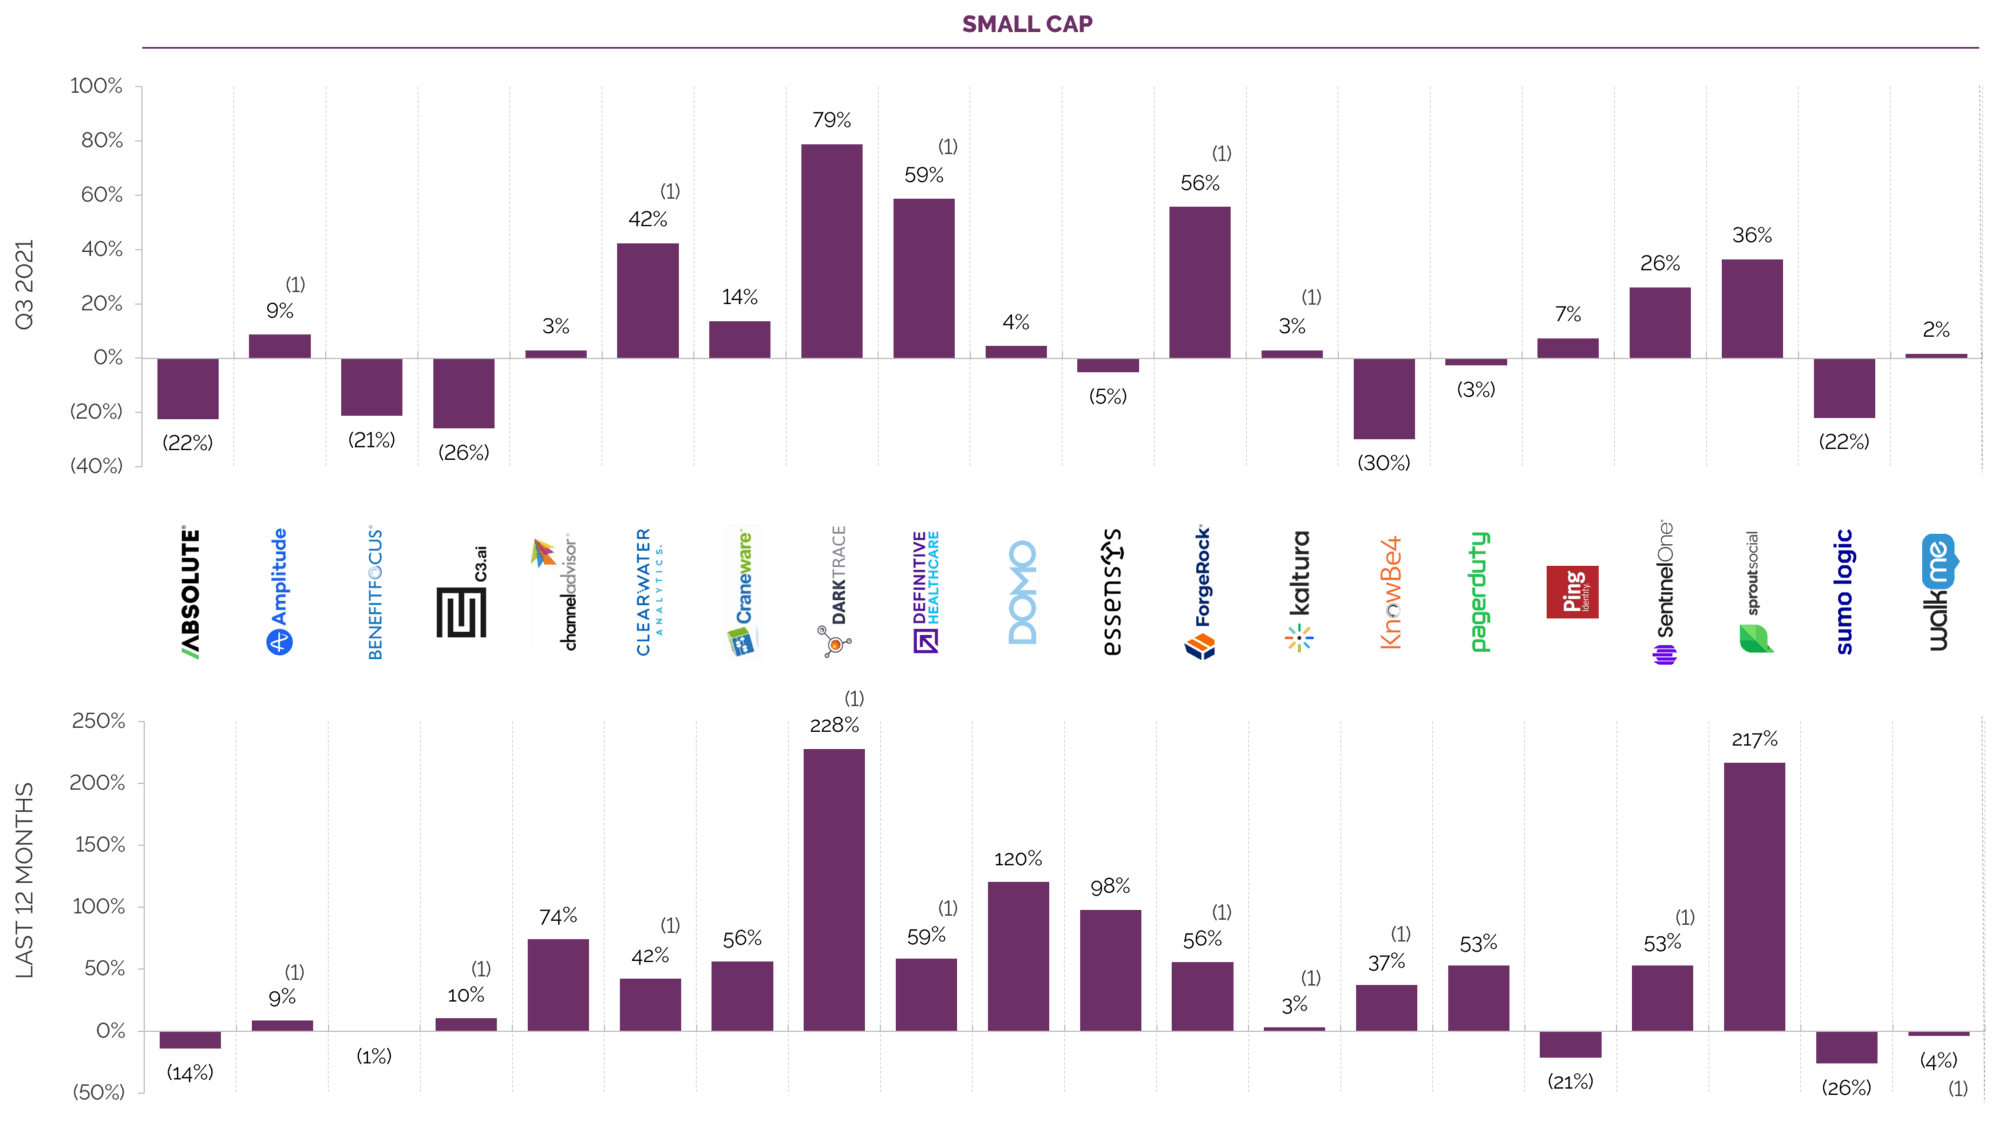
(1) These companies IPO’d within the last 12 months/last quarter, the share price movement represents the change between the stock’s IPO date and 30th September 2021. Note: Based on share prices as at 30th September 2021. Sources: Capital IQ and Results analysis
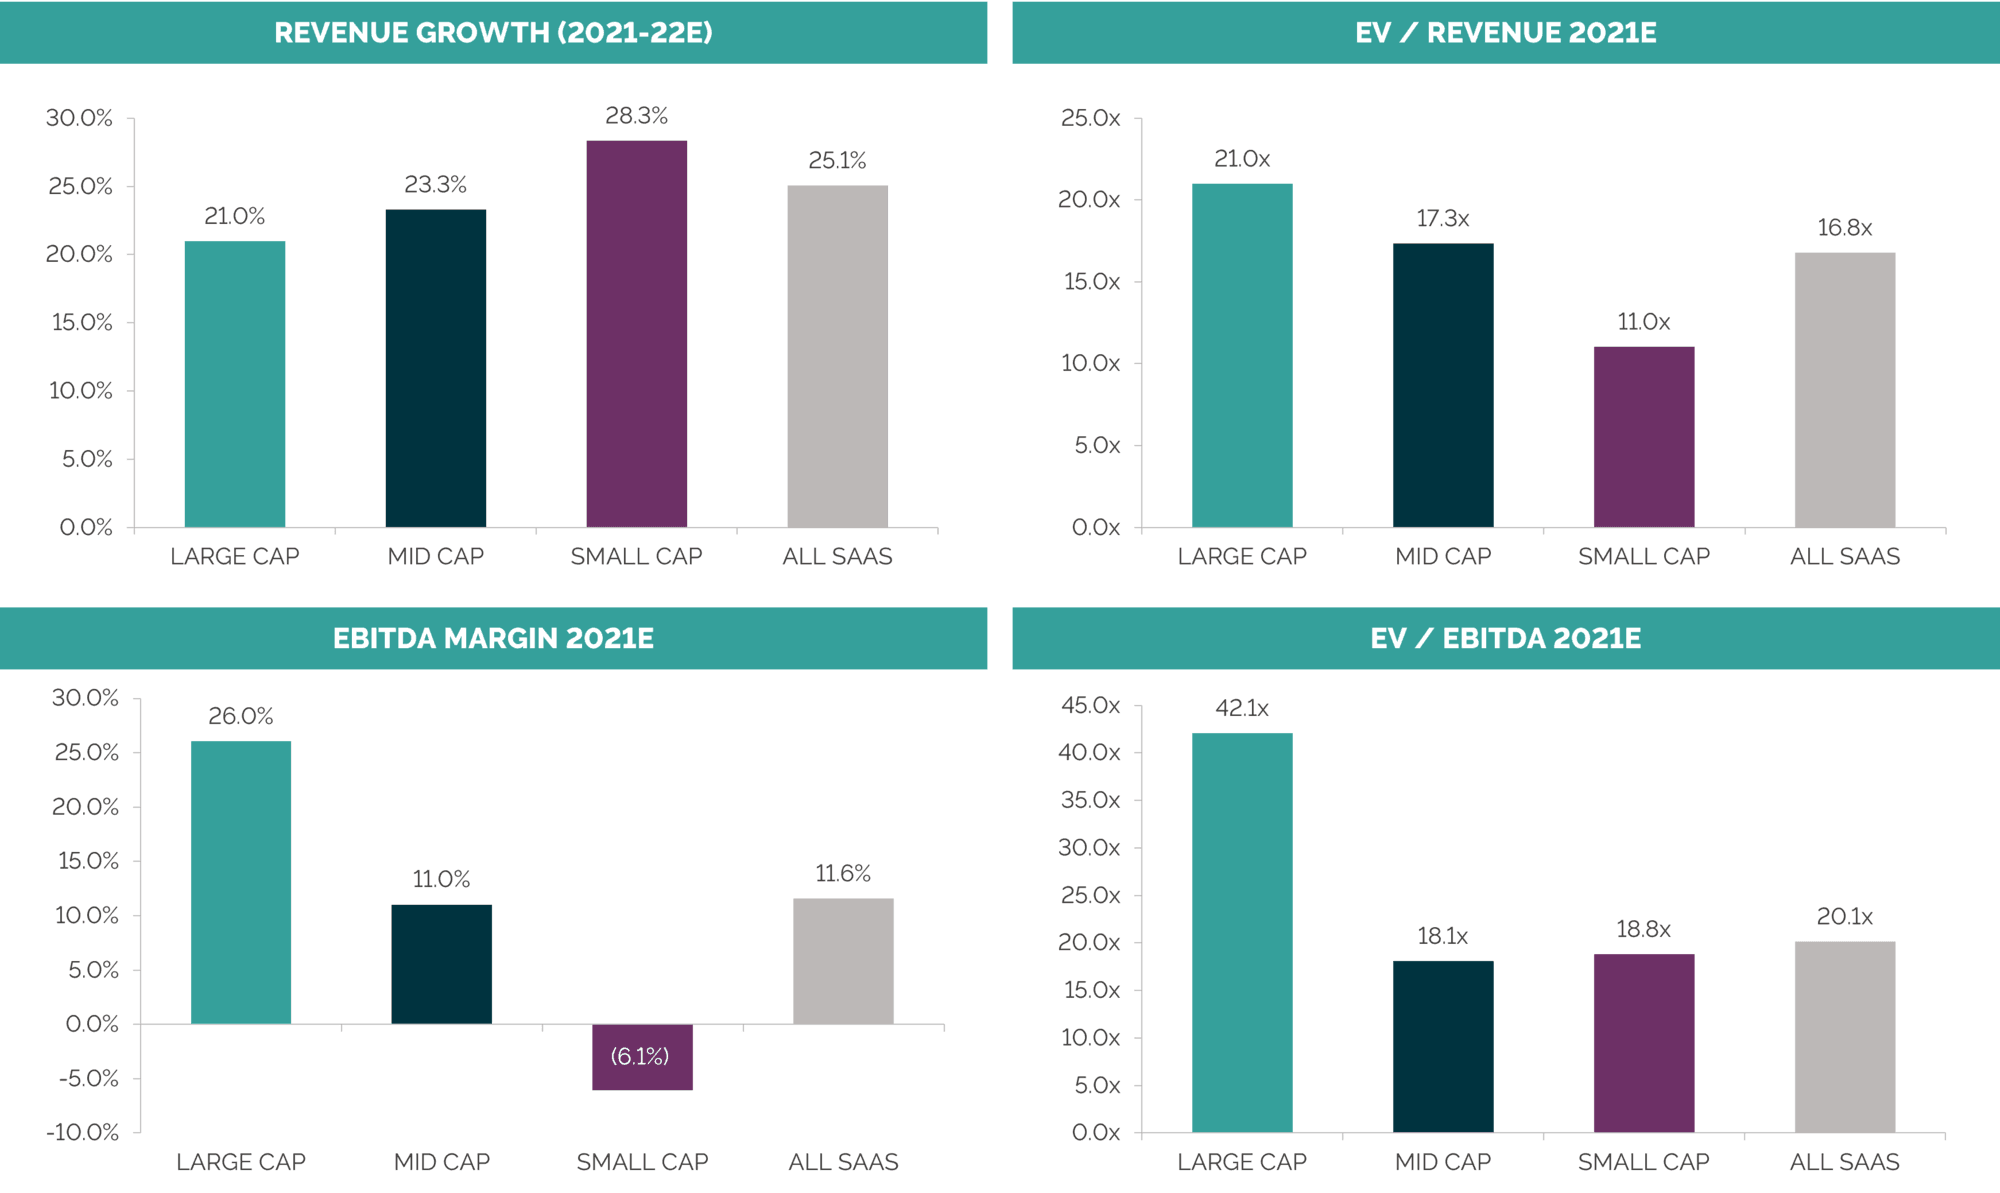
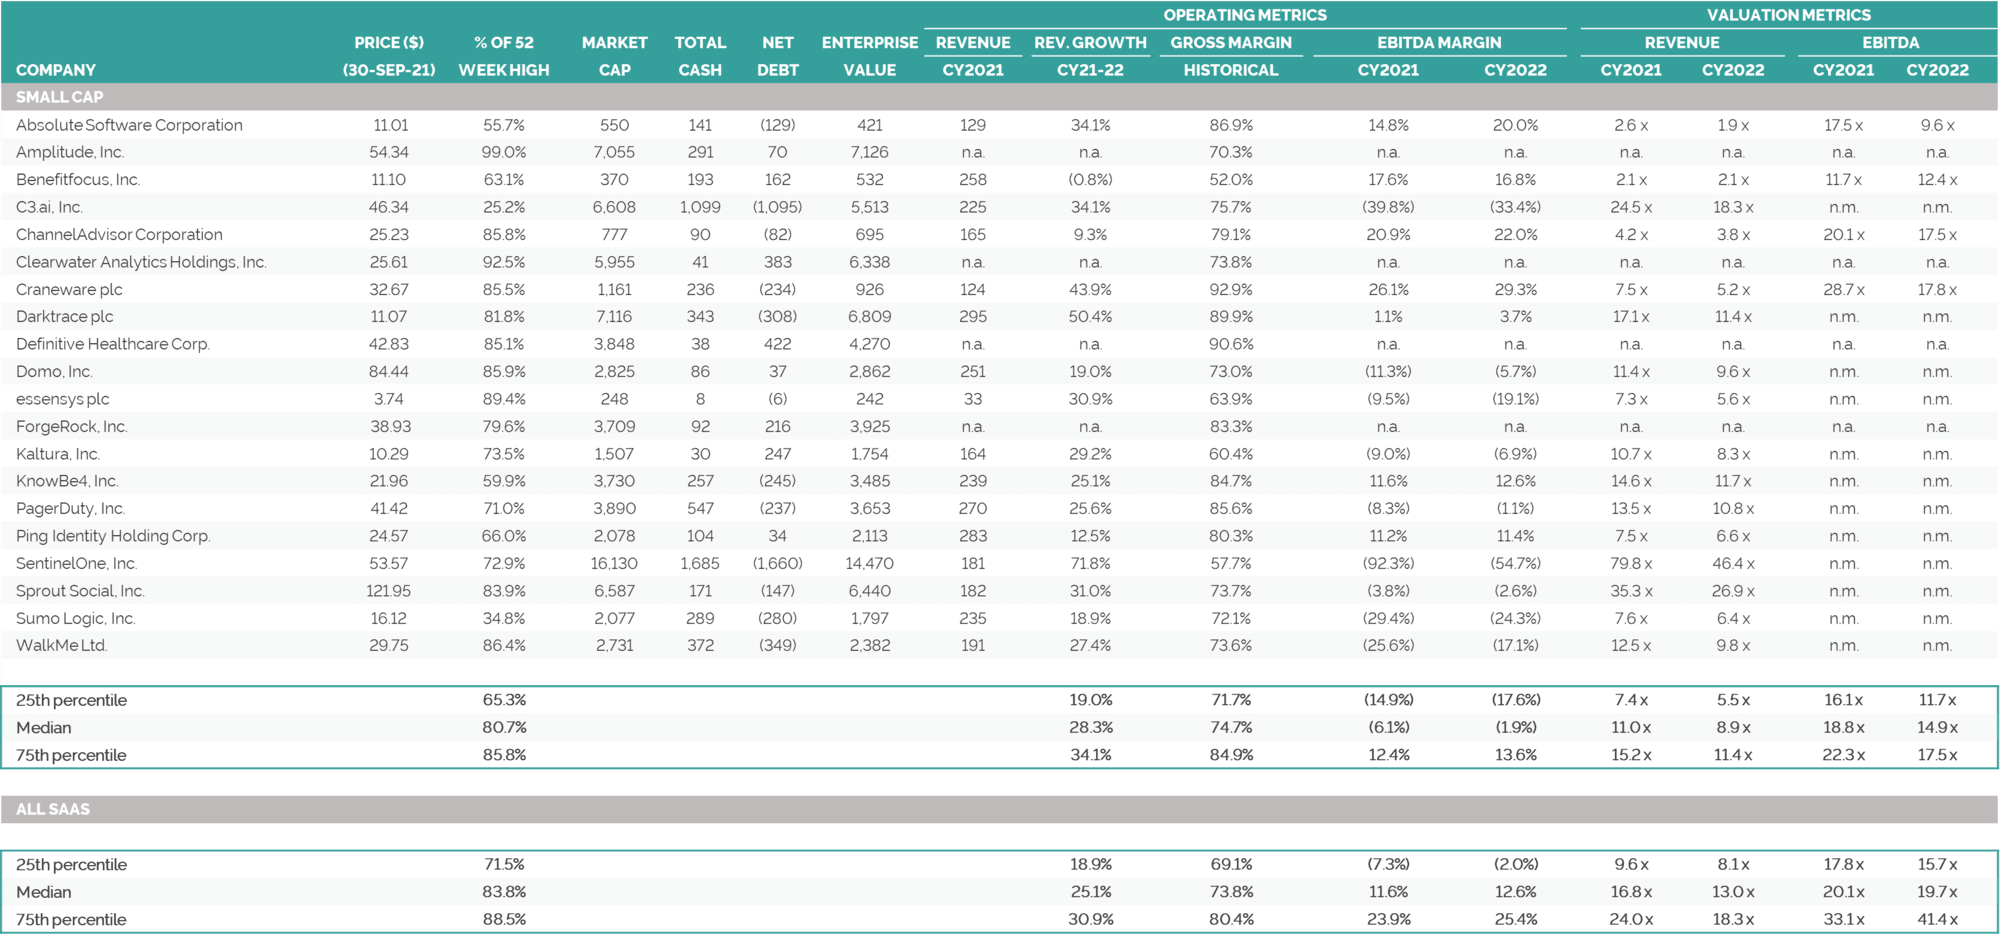
1) All SaaS represents the median of all stocks in Large Cap, Mid Cap and Small Cap, with no weighting applied. Notes: EV = Enterprise Value; financials calendarised to December year end; median values reported. See Selected Publicly Traded Companies (click here) for details of companies included in each category. Sources: Capital IQ and analyst reports
(1) Number of companies with applicable multiples in Q3 2021 index; Notes: EV = Enterprise Value; financials calendarised to December year end, which can impact the multiples at the start of each year as the base is shifted forward; weekly tracking of valuation multiples commenced in July 2015, October 2014 – September 2015 tracked on a quarterly basis, therefore a linear progression has been assumed between quarters up to July 2015. Dotted line represents median since data has been tracked. Source: Capital IQ
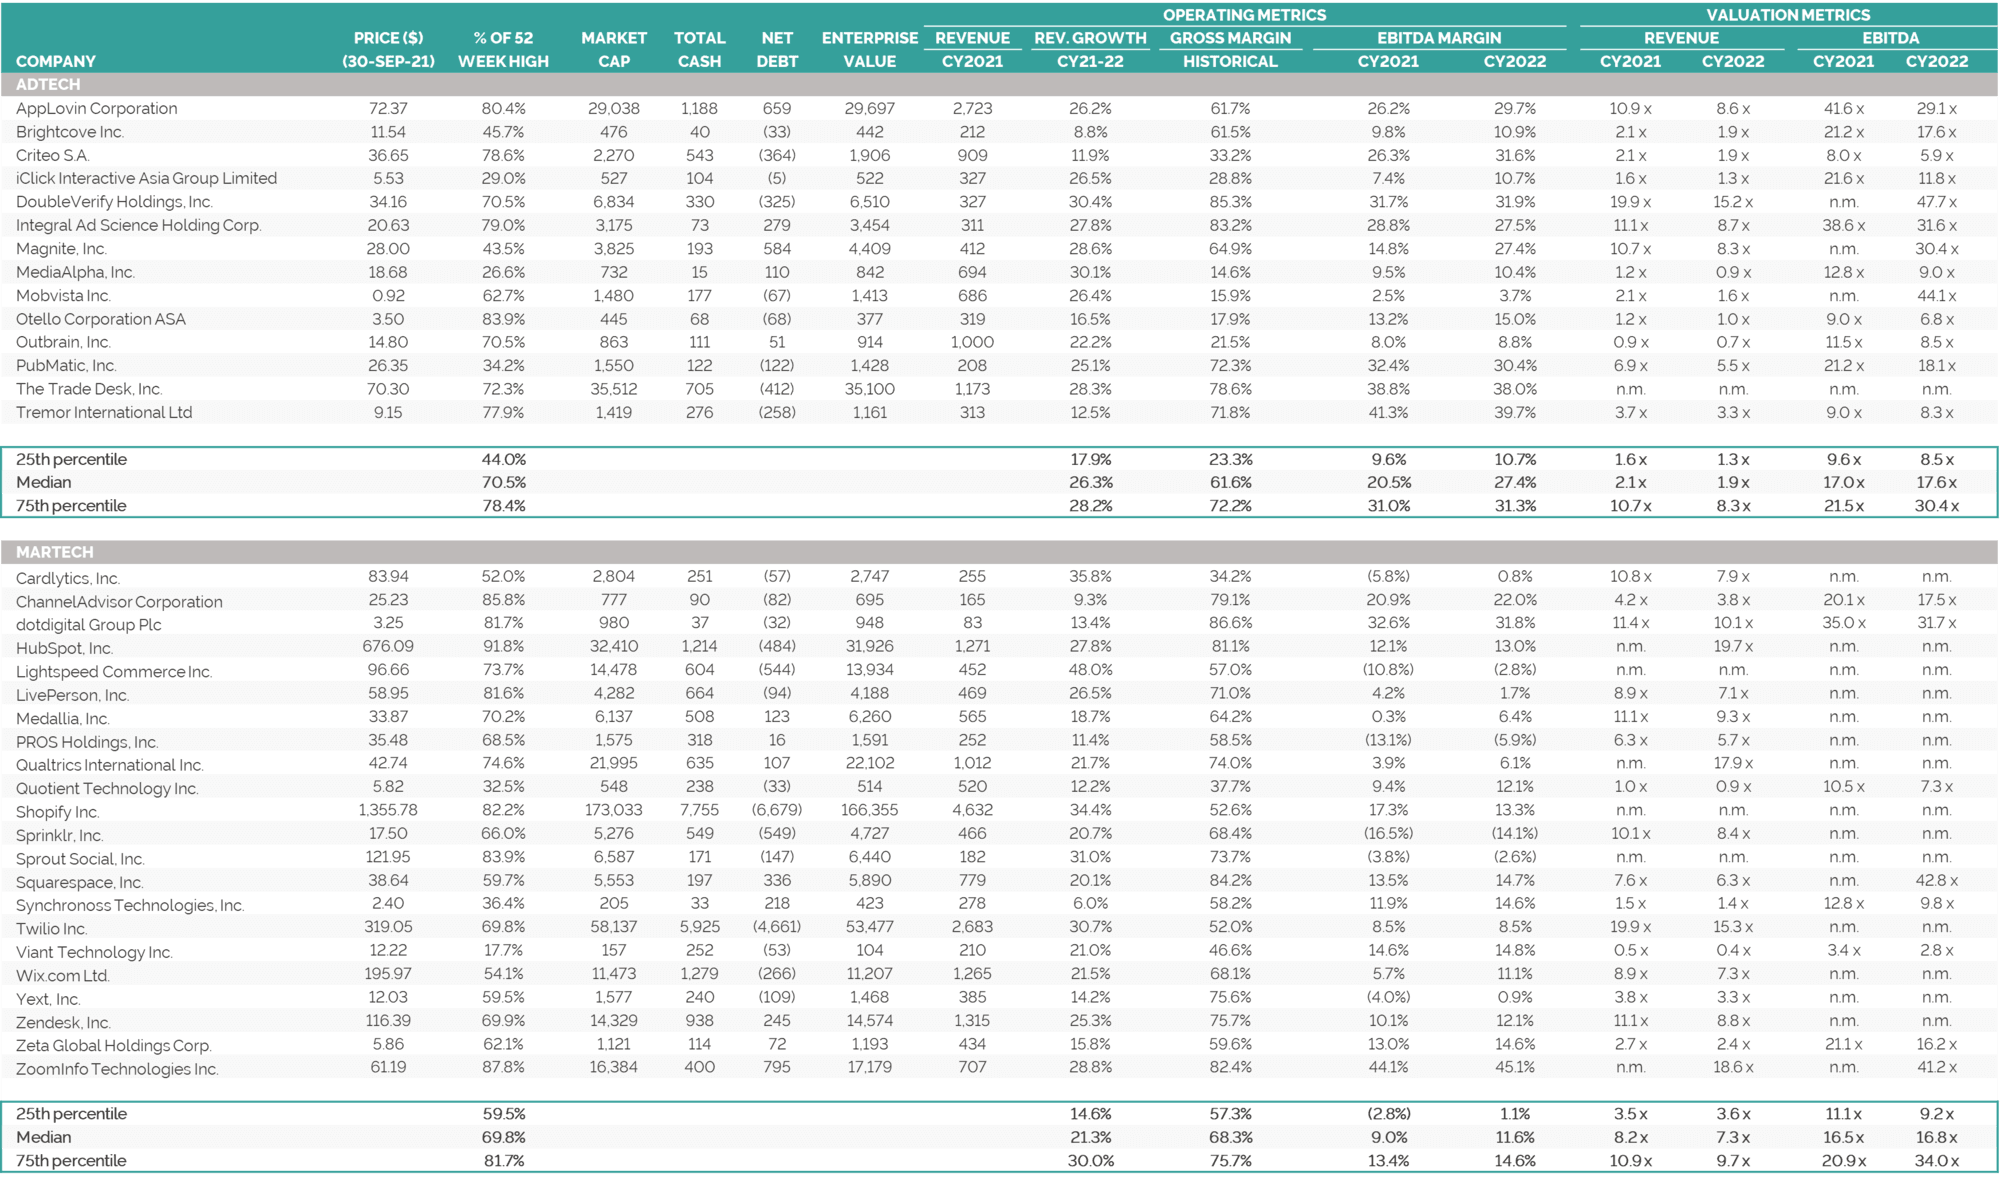
Note: Calendarised to December year end; $ millions, except share price data; multiples capped at 20x EV / Revenue and 50x EV / EBITDA; net debt includes minority interest. Sources: Capital IQ and broker reports
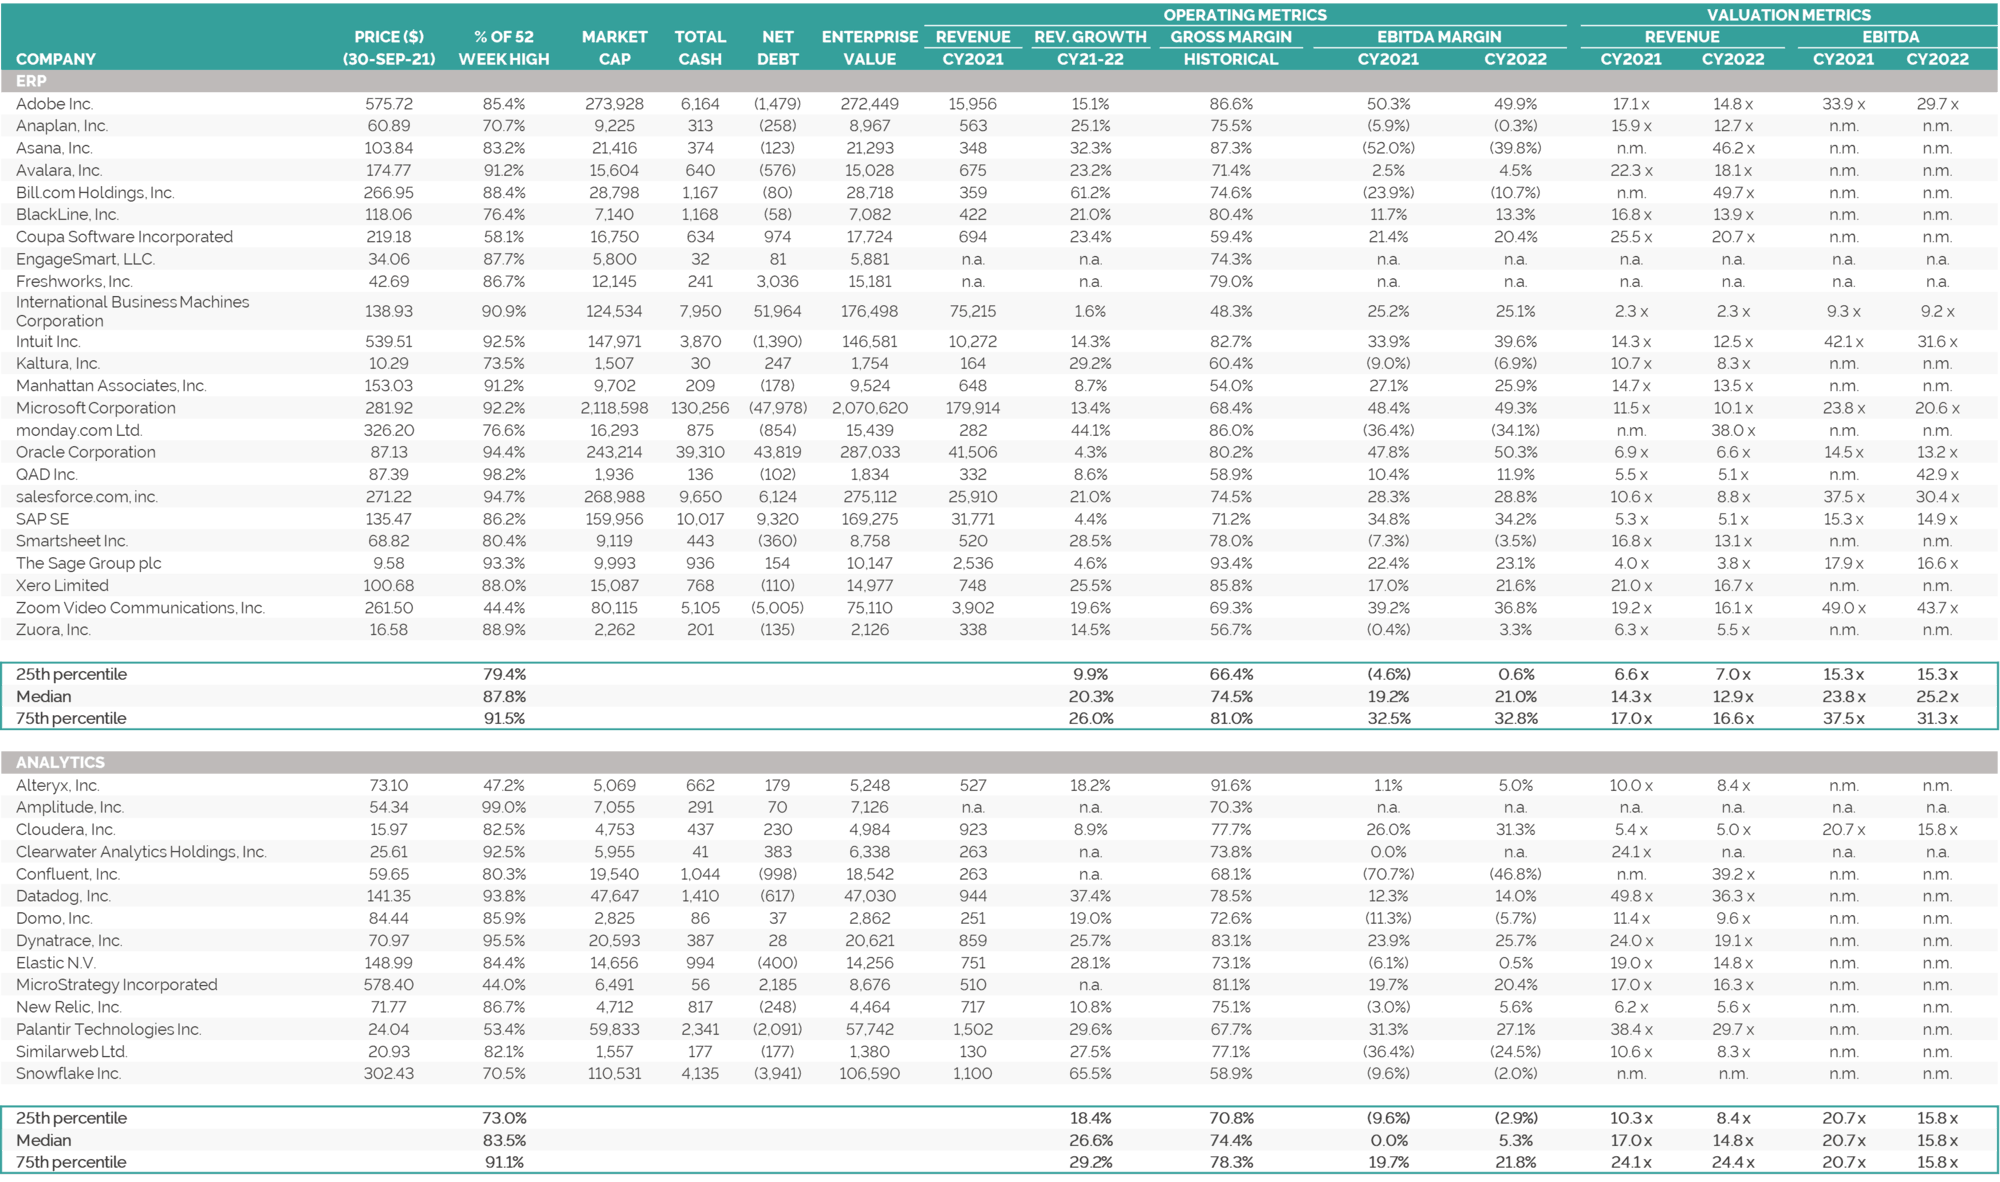
Note: Calendarised to December year end; $ millions, except share price data; multiples capped at 20x EV / Revenue and 50x EV / EBITDA; net debt includes minority interest. Source: Capital IQ
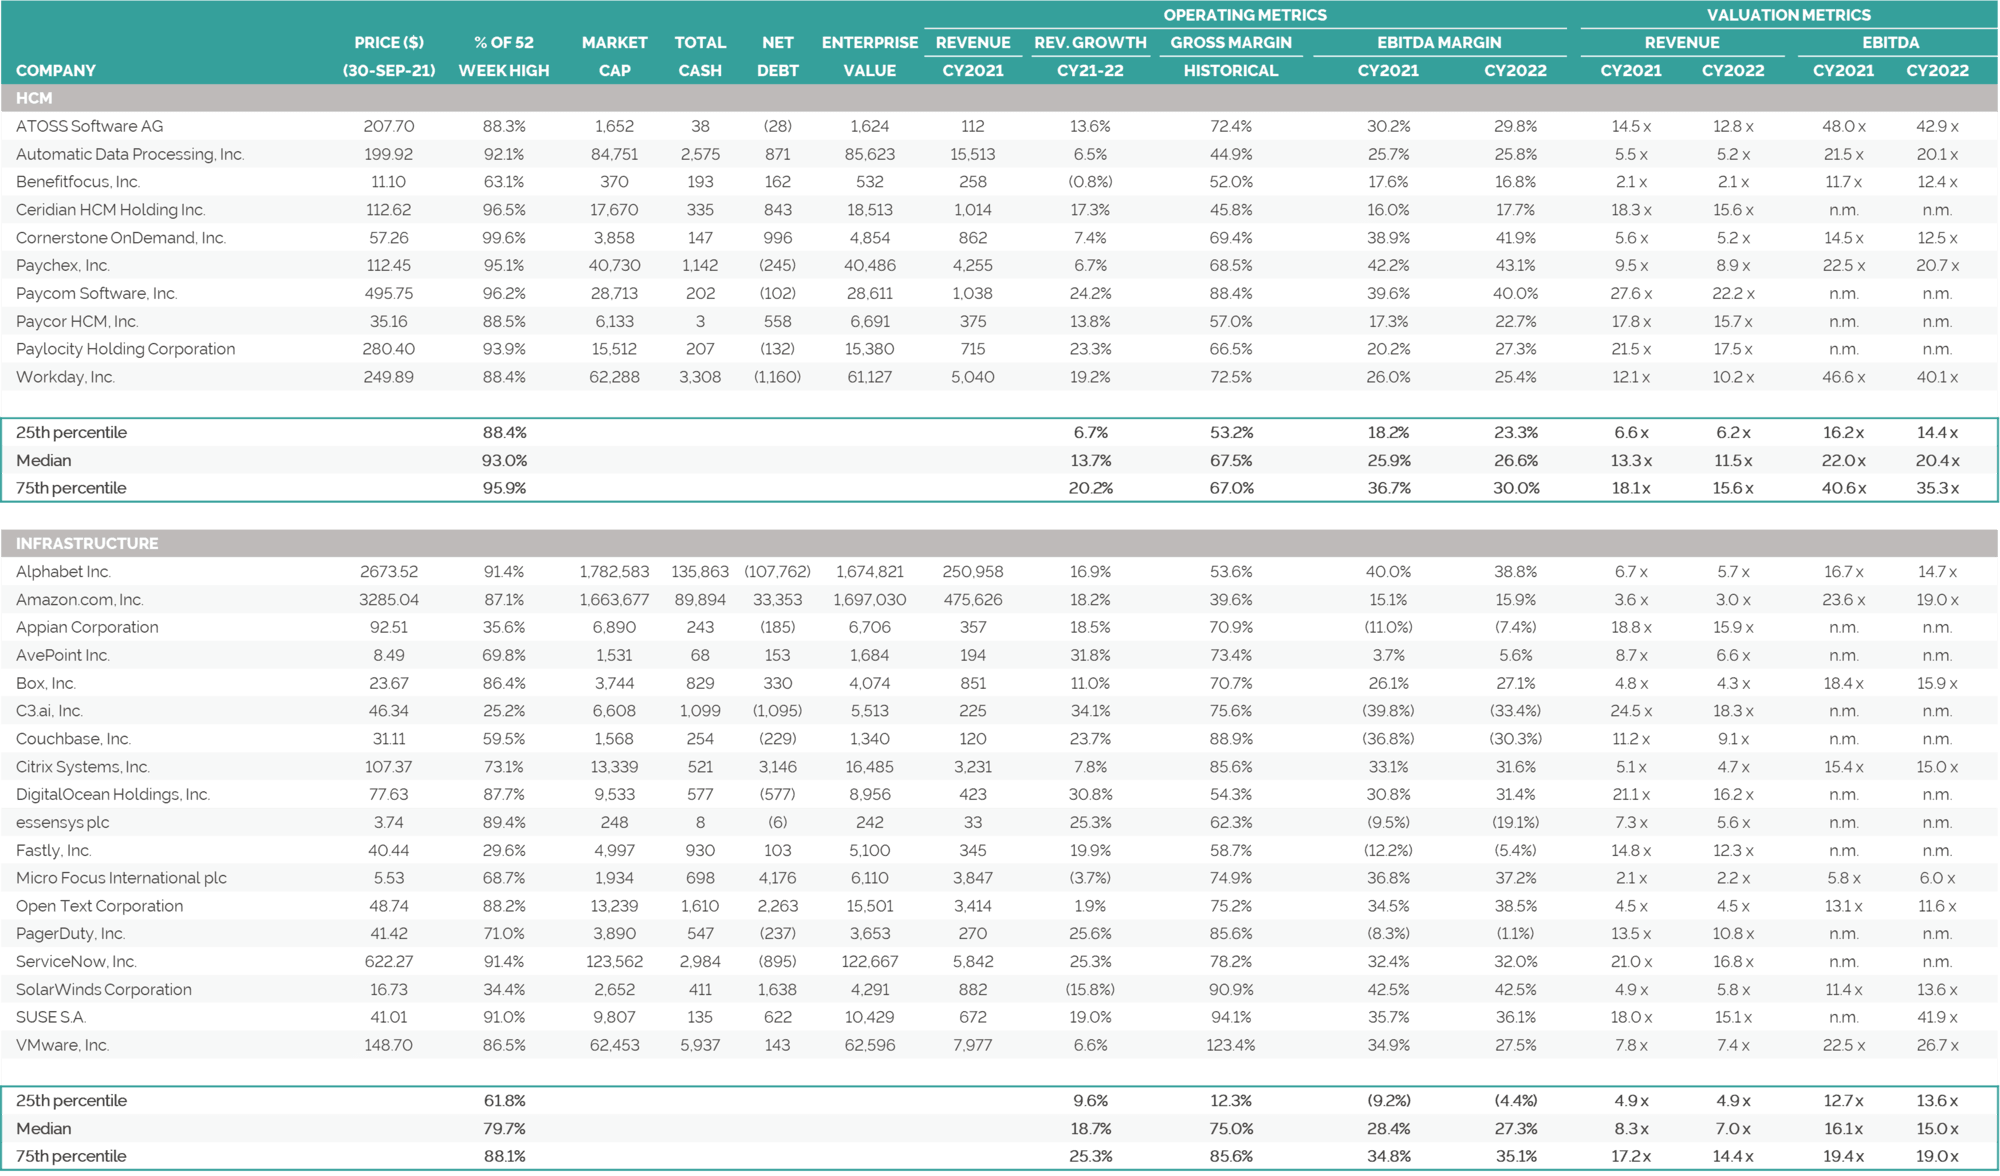
Note: Calendarised to December year end; $ millions, except share price data; multiples capped at 25x EV / Revenue and 50x EV / EBITDA; net debt includes minority interest. Source: Capital IQ.
Note: Calendarised to December year end; $ millions, except share price data; multiples capped at 100x EV / Revenue and 50x EV / EBITDA; net debt includes minority interest. Note: Market cap classifications categorised by CY2021E revenue or LTM where CY2021E revenue not available: Large Cap: revenues greater than $900m; Mid Cap: revenues between $300m and $900m; Small Cap: revenues less than $300m. Source: Capital IQ
Note: Calendarised to December year end; $ millions, except share price data; multiples capped at 100x EV / Revenue and 50x EV / EBITDA; net debt includes minority interest. Note: Market cap classifications categorised by CY2021E revenue revenue or LTM where CY2021E revenue not available : Large Cap: revenues greater than $900m; Mid Cap: revenues between $300m and $900m; Small Cap: revenues less than $300m. Source: Capital IQ